Environmental Engineering Reference
In-Depth Information
CO
2
emissions
from lime in fields
4%
Sugarcane
transportation
7%
EtOH
transportation
8%
Sugarcane
farming
9%
Fertilizer production
16%
N
2
O emissions
from fields, 14%
Sugarcane field burning
24%
EtOH processing
17%
0%
10%
20%
30%
40%
50%
60%
70%
80%
90%
100%
FIGure 11.15
Brazilian sugarcane ethanol life-cycle GHG emissions. (From Wang, M., et al.,
Well-to-
Wheels Energy Use and Greenhouse Gas Emissions of Brazilian Sugarcane Ethanol Production Simulated
by Using the GREET Model,
Argonne National Laboratory, Argonne, IL, 2007.)
20%
Corn EtOH
(coal)
0%
-20%
Corn EtOH
(average)
Corn EtOH
(NG)
-40%
Corn EtOH
(DGS)
Corn EtOH
(biomass)
-60%
-80%
Sugarcane EtOH
Cellulosic EtOH
-100%
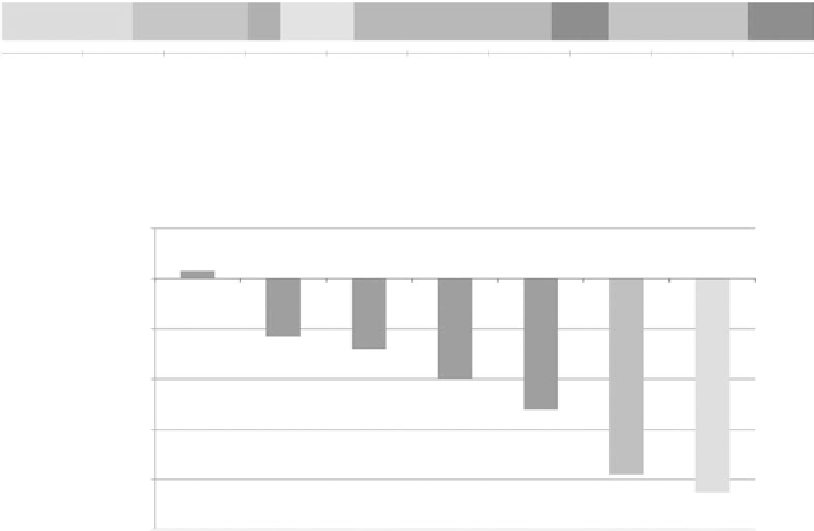
FIGure 11.16
Change in life-cycle GHG emissions, relative to petroleum. (From Wang, M., et al.,
Well-to-
Wheels Energy Use and Greenhouse Gas Emissions of Brazilian Sugarcane Ethanol Production Simulated
by Using the GREET Model,
Argonne National Laboratory, Argonne, IL, 2007.)
Wang et al.'s (2007) life-cycle GHG results shown in Figure 11.16 are relative to petroleum.
According to the study, if the ethanol refinery used coal as its process fuel, GHG emissions would
be higher than those of the petroleum baseline. In the two corn ethanol scenarios with the greatest
GHG reductions, the DGS co-product or field-collected biomass residue were burned in the process-
ing plant to supplement energy requirements, much like cane residue use in the sugarcane scenario.
Surplus electricity from bagasse combustion in the sugarcane mill was assumed to displace natural
gas electricity from the grid. Wang et al.'s (2007) study found these avoided emissions to be the
primary reason sugarcane ethanol can substantially reduce life-cycle GHGs.
11.2.3.3 Biodiesel
Because of the high uncertainty involved in estimating N
2
O emissions, Sheehan et al. (1998) did not
include this parameter in their model. Petroleum diesel life-cycle CO
2
was dominated by tailpipe
emissions, which contributed 87% of the total. The next-largest source of GHG emissions was crude
oil refining. Most crude petroleum extraction was by conventional onshore and offshore methods.
If economic or policy drivers caused wider adoption of either the energy-intensive steam injection
or CO
2
injection methods, crude oil production GHGs could significantly change. However, even
if CO
2
emissions from crude production doubled or tripled, fuel combustion would still dominate
life-cycle CO
2
emissions (see Figure 11.17).
In the biodiesel life-cycle system, vehicle tailpipe CO
2
emissions are offset by CO
2
uptake dur-
ing soybean plant growth, as shown in Figure 11.18. Sheehan et al. (1998) found that B20 and B100
reduce life-cycle CO
2
emissions by 16 and 78%, respectively, when compared with petroleum die-
sel. Note that this study predates the more recent considerations of incorporating indirect land-use
change GHG emissions, as in the EPA Renewable Fuel Standard modeling (EPA 2010) discussed