Environmental Engineering Reference
In-Depth Information
Well-to-pump, hybrid
Well-to-pump, market
Well-to-pump
Well-to-pump, energy
Well-to-pump, displacement
1,600,000
1,400,000
1,200,000
1,000,000
800,000
600,000
400,000
200,000
0
Biodiesel
Supercetane
Green diesel
Renewable
gasoline
-200,000
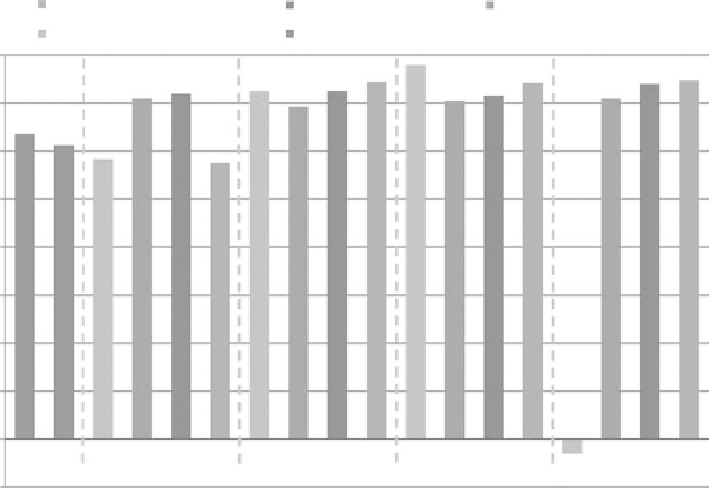
FIGure 11.11
Well-to-pump energy requirements of six fuel production systems for various allocation
methods. (From Huo, H., et al
., Life-Cycle Assessment of Energy and Greenhouse Gas Effects of Soybean-
Derived Biodiesel and Renewable Fuels.
ANL/ESD 08-2, Argonne National Laboratory, Argonne, IL, 2008.)
in pathway 2 the co-product fuel gas and heavy oils were used to generate steam for supercetane
production, whereas green diesel required natural gas to supply steam. Internally used supercetane
co-products were subtracted from net co-product production (net co-products are those which exit
the system boundary). Several commercial hydrogenation biodiesel production facilities are already
in operation around the world.
The energy content of the four soybean-based fuels, petroleum gasoline, and low-sulfur diesel
varies by 12%, which was accounted for by normalizing to 1 million Btu of fuel produced and con-
sumed. Figure 11.11 shows the well-to-pump energy requirements of all six fuel pathways. Pump-
to-wheel energy is not shown in the figure because it is the same for each fuel.
Production of green diesel resulted in the least energy co-products, which is why its well-
to-pump energy calculated by displacement allocation was relatively high; compared with the
other biofuel systems, fewer conventional products were displaced. Renewable gasoline production
resulted in vast amounts of energy co-products, leading to the lowest well-to-pump energy use per
million Btu of fuel produced and most petroleum displaced, as seen in Figure 11.12. The pump-
to-wheel petroleum use of gasoline and diesel includes the fuel itself, which of course is zero for
the bio-based fuels.
11.2.3 l
ifE
-c
yclE
ghg E
miSSionS
11.2.3.1 modeling uncertainty
The following are examples of modeling uncertainties in biofuel LCA that can affect net GHG
emissions calculations.
N
2
O is a potent GHG, produced naturally from mineral nitrogen in the soil by microbes. Soil
nitrogen (N) content depends on agricultural practices, such as fertilizer application, production
of nitrogen-fixing crops, and retention of crop residues. For the states analyzed by the USDA in a
recent survey, nitrogen fertilizer was applied to 96% of U.S. corn acres (USDA/ERS 2008b). In total,