Environmental Engineering Reference
In-Depth Information
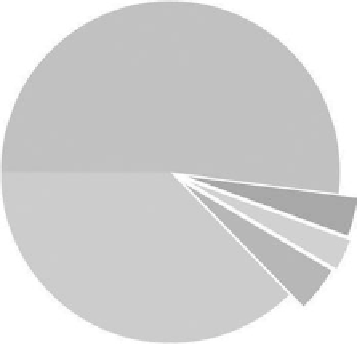
United States
9.00
52%
Rest of World
0.63
4%
Brazil
6.47
37%
China
0.50
3%
European Union
0.73
4%
FIGure 11.2
World fuel ethanol production in billion gallons, 2008. (Data from RFA, Industry statistics: 2008
world fuel ethanol production table, Renewable Fuel Association, available at http://www.ethanolrfa.org/
industry/statistics/#E (accessed July 27, 2009), 2009a.)
its life-cycle impacts are significant. Soybeans are the primary U.S. biodiesel feedstock, whereas
Europe uses rapeseed and sunflower oil, and Malaysia uses palm oil (EIA 2007). Other biofuel
feedstock sources include sugarbeets, wheat, and potatoes for ethanol, and jatropha, palm oil, coco-
nuts, and canola for biodiesel (Quirin et al. 2004). The following section primarily focuses on corn
ethanol, sugarcane ethanol, and soybean biodiesel fuel production pathways.
11.2.2
l
ifE
-c
yclE
E
nErgy
11.2.2.1 ethanol
One of the most discussed biofuel topics is life-cycle energy. Does it cost more net energy to produce
liquid fuel from corn than from crude petroleum, and which feedstock crops have the lowest life-
cycle energy requirements? Direct comparison of results across studies is often difficult because
of variance in system boundaries, allocation methods, and data sources. Here we will discuss the
results and key assumptions from some significant biofuel life-cycle studies.
The general consensus on corn ethanol is that it is energetically beneficial compared with gasoline,
although the degree of this benefit varies and is sensitive to modeling assumptions. Farrell et al. (2006)
performed a meta-analysis using the ERG Biofuel Analysis Meta-Model (EBAMM) to analyze six
corn ethanol biofuel studies that best represented the perspectives of the original authors. Some of the
studies included or excluded different parameters and allocation methods, making comparison dif-
ficult, or used low-quality and unverifiable data. System boundaries were redrawn to correct for these
inequalities and where necessary add the following parameters: farm machinery embodied energy,
inputs packaging, capital equipment embodied energy, process water, effluent restoration, and co-
product credits. Although Farrell et al. (2006) pointed out the inadequacy of net energy as a metric,
they used it to compare previous study results because it was used by the original authors.
Figure 11.3 shows the EBAMM analysis life-cycle energy results. In the figure, the hollow circles
represent the results originally published by the respective authors and the filled circles represent the
EBAMM-adjusted values. The vertical axis metric was purposely designed by Farrell et al. (2006)
to address the U.S. policy goal of reducing fossil fuel dependence. Only the Pimentel (Pimentel and
Patzek 2005) and Patzek (Patzek 2004) biofuel studies calculated net energy values less than zero
(also less than gasoline), although both studies still show a significant reduction in net petroleum
consumption in comparison to gasoline. The cellulosic scenario shows a high net energy balance,
but no significant reduction in petroleum input requirements per megajoule of ethanol fuel produced