Environmental Engineering Reference
In-Depth Information
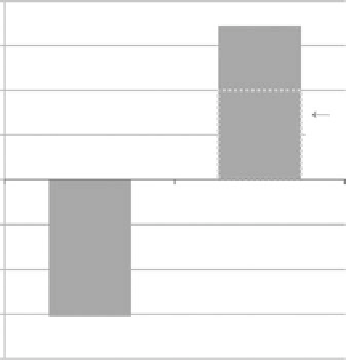
8
6
4
Co-product
displacement
credit
2
Pimental (2005)
0
Wang (1999)
-2
-4
-6
-8
FIGure 11.1
NEV of two corn ethanol life-cycle studies. (From Farrell, A.E. et al.,
Science
, 311, 506-508, 2006.)
equilibrium modeling is not integrated into life-cycle analysis, but it remains an active area of
research (Delucchi 2008; Kammen et al. 2008).
To get an idea of the relative effect of allocation, consider Figure 11.1, which shows the life-cycle
energy of two corn ethanol LCAs (Farrell et al. 2006). Pimentel's study calculated an NEV of -6.1
whereas results from Wang's GREET model show an NEV of +6.9. Wang's study used the displace-
ment method to calculate the benefits of co-product use in the market, whereas Pimentel's study
did not use any allocation method. The importance of selecting an appropriate allocation method
is likely to grow as further optimization of biorefinery processes will potentially lead to a more
diverse and efficiently produced portfolio of high-value co-products (Lyko et al. 2009).
11.1.5 d
ata
Data collection is one of the greatest challenges in LCA because data may be proprietary, aggregated,
or inconsistently available. Because biofuel production technology changes relatively rapidly, age of
data is very important. For example, most current ethanol production facilities have been built since
2003, and fuel production has more than tripled (RFA 2009b). The energy efficiency of newer corn
grain-to-ethanol conversion facilities has also increased (Perrin et al. 2009). In general, energy data
tend to be more accurate than air emissions data because differences in regulatory limits, technol-
ogy, and measurement practices cause greater variance in the values (Keoleian and Spitzley 2006).
Aside from age, data can also be characterized in terms of source and quality. Primary data are
collected directly (e.g., by taking measurements of process inputs or obtaining information from a
facility manager), and ISO 14041 documentation standards should be observed. Frequently, primary
data are unavailable and secondary data, available from LCI databases and literature sources, must
be used. Secondary data may represent industry-wide average values for process inputs or outputs,
which can account for the mix of older and newer technologies in use.
Data quality is another important consideration, addressable using the following indicators:
• Precision:
Measure of data variability.
• Completeness:
Fraction of total primary sources reporting data.
• Representativeness:
Temporal, geographic, and technology characteristics.
• Consistency:
A qualitative assessment of uniformity of analysis methodology (i.e., a
standardized data collection method).
• Reproducibility:
The study can be independently repeated and achieve the same result.