Information Technology Reference
In-Depth Information
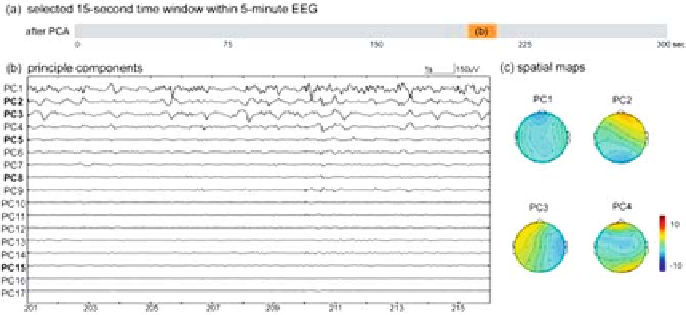
Fig. 4.8: The selected EEG segment and PCA results within the same time win-
dow as in Fig. 4.4 from patient 1. (
a
) The 15-s time window (201-216 s) is used to
display results in (
b
). (
b
) The 17 decomposed PCs show that the temporal wave-
forms of the first four principal components (eigenvectors corresponding to the first
four largest eigenvalues) merely exhibit the preservation of the most power of the
original signals. (
c
) The corresponding spatial maps of PC1 to PC4. None of them
extracted the evident eyeblinking artifacts or CJD-related features from raw EEG as
compared to the ICA results in Fig. 4.4.
and IC5 in Fig. 4.4d, respectively. In addition, it should be noted that any 5-min IC
waveform only corresponds to a single spatial map and the predominant region for
IC3, IC4, and IC 5 is manifested in Figs. 4.2e, 4.3e, and 4.4e, respectively. On the
contrary, the topographical maps produced from the peak times of the similar wave-
forms in the raw data varied from one to another. To illustrate this, we particularly
chosen four peak times of the disease-related IC waveforms and displayed the topo-
graphical maps based on the raw EEG at these peak times. As shown in the vertical
lines in Fig. 4.2b or d, four peak time points p1, p2, p3, and p4 of four waves in
IC3 at 3.3, 5.1, 9.6, and 10.9 s were selected and the corresponding topographical
maps produced from the raw data presented distinct patterns (Fig. 4.2c), which were
difficult to interpret for further analysis. Similar phenomenon and difficulty can be
seen in Figs. 4.3c and 4.4c.
Another salient feature of ICA is that, even a CJD-related wave hid at different
time windows and obscured across multiple channels, ICA is effective to extract
such waveforms from different channels into a single independent component, as
illustrated by IC3 in Figs. 4.2d, e and 4.4d, e, where repeated waves of PLEDs were
identified in IC3 which occurred during 2-17 and 201-216 s. Besides, muscular ar-
tifacts and environmental noise have been isolated by ICA which were in congruent
with previous studies [14, 15, 23]. The intermittent high amplitude waves induced
by eyeblinks with maximum over the prefrontal area were presented within IC2 in
Figs. 4.2d, e and 4.3d, e, large irregular waves caused by eye movements on the left
frontal region were within IC8 in Figs. 4.2 and 4.3d, e, and environmental noises