Information Technology Reference
In-Depth Information
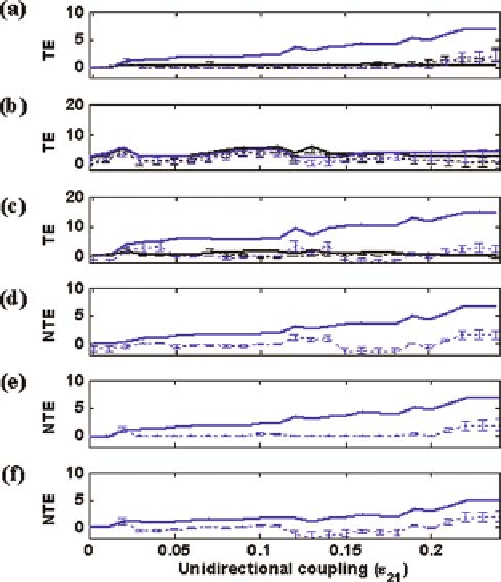
Fig. 15.2: Transfer entropy TE and net transfer of entropy NTE between coupled
oscillators 1 and 2 (1
99.5% error bars
of their corresponding 50 surrogate values as a function of the systems' underly-
ing unidirectional coupling
→
2
black line
,2
→
1
blue line
) and mean
±
ε
21
(from 0 to 0.25). Each TE value was estimated from
=
,
N
21
was increased by a step of
0.01. (
a
)TE
o
(original data), mean, and 99.5% error bars from the distribution of
TE
s
(surrogate data). With
k
10
000 data points at each
ε
21
.Thevalueof
ε
=
16,
l
=
1 (i.e., the suggested values by our method-
ology), TE is estimated at radius
r
∗
within the linear region of ln
C
(
r
)
vs. ln
r
from the original data (see Fig. 15.1c). TE
o
(2
→
1) (
solid blue line
) is statistically
significant (
p
<
0.01) and progressively increases in value with an increase in
ε
21
,
whereas TE
o
(1
2) (
solid black line
) is only locally statistically significant and re-
mains constant and very close to 0 despite the increase in
→
ε
21
.(
b
) TEs estimated
with
k
=
5,
l
=
5 as an average of the TEs at intermediate values of the radius
r
[
σ
/
5
<
ln
r
<
2
σ
/5]. Neither TE
o
(2
→
1) nor TE
o
(1
→
2) is statistically significant
(
p
>
0.01) and does not progressively increase in value with an increase in
ε
21
.(
c
)
TE estimated with the optimal values
k
1. The picture is very similar to
the one in (a) above, suggesting that use of
r
∗
is not critical in the estimation of TEs.
(
d
)NTE
o
(2
=
16,
l
=
→
1) and their corresponding NTE
s
(2
→
1) estimated from the TE values
in (
c
). (
e
)Asin(
d
) above with noise of SNR
=
10 dB added to the data. (
f
)Asin
(
d
) above with more noise (SNR
3 dB) added to the data. Detection of direction
of information flow is possible at all
=
ε
21
values (
p
<
0.01), except at very small
ε
21
values (
0.02). Units of the estimated measures TE and NTE are in bits per it-
eration (time step was 0.1, i.e., Runge's time step 0.01
times
10, because of the 10:1
ε
21
<