Information Technology Reference
In-Depth Information
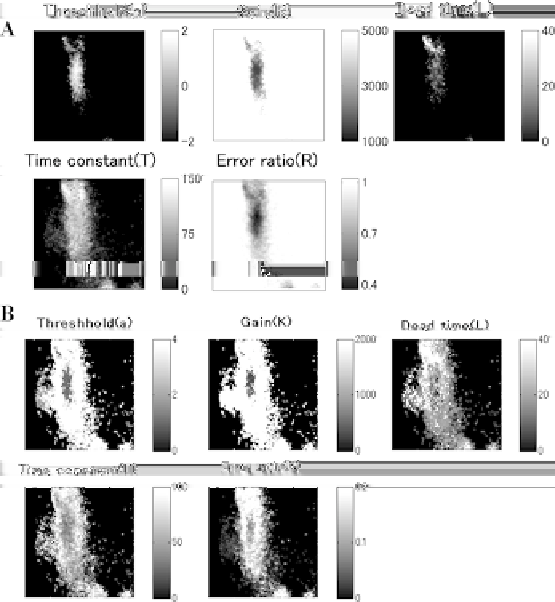
Fig. 12.6: Distribution of the mean values and the standard deviation values of the
model parameters and the estimation error ratio.
a
: Mean value
b
: Standard devia-
tion values.
12.3.2 Classification of Pixel Activity Patterns
We then categorized respiratory related pixels according to the criteria described in
the previous section. The values of the criteria are shown in Fig. 12.7a. We next
compared the estimated and the actual values for a representative pixel in each cat-
egory. As shown in Fig. 12.7b, we obtained a good estimate using Type-1 or Type-2
pixels, even in the case of the SISO model. The dead time of Type-1 pixel was large,
whereas the dead time and the gain were both small in Type-2 pixels. We did not
obtain a good estimate using Type-3 pixels. The estimation precision became even
worse when we use a Type-4 pixel. Type-5 pixels gave a good estimate, but the gain
was high.
Figure 12.8 shows the spatial distribution of activity patterns of respiratory re-
lated pixels. Type-1 pixels were mostly distributed in the pFRG region, and Type-2
pixels were mainly distributed in the pre-BotC. These results are consistent with