Information Technology Reference
In-Depth Information
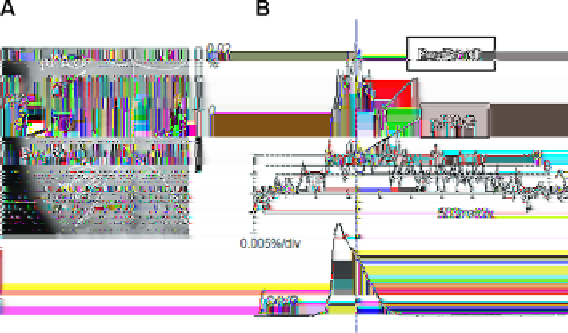
Fig. 12.1: Examples of cases with arbitrarily set threshold that may mislead the
timing of the onset of optical signals.
a
: Respiratory related optical signals on the
ventral surface of the medulla in a rat brainstem-spinal cord preparation. Region of
interests (ROIs) were set in the pFRG area and the pre-B otC area. The anterior infe-
rior cerebellar artery, the basilar artery, and the vertebral artery are demarcated with
white dotted lines
. IX/X, XII, cranial nerves.
b
: Integrated C4VR activity (
C4VR)
and optical signal waveforms in the pFRG area and the pre-BotC area, which cor-
respond to the ROI on the photograph on panel A. The
vertical line
indicates the
timing at which the voltage image was computed.
Horizontal dotted lines
represent
different thresholds. If the threshold level is the
horizontal dotted line
a, then optical
signals in both pFRG and pre-BotC areas appear simultaneously at the preinspira-
tory period. If the threshold level is b, then only optical signals in the pFRG area
appear at the preinspiratory period. If the threshold level is c, then optical signals
first appear in the pre-BotC area at the onset of inspiration, and subsequently signals
appear in the pFRG area. Therefore, images could mislead the timing of the onset
of optical signals.
basic types of respiratory neurons. Oku et al. [22] have developed a method to iden-
tify respiratory related pixel areas by calculating the cross-correlation between the
forth cervical spinal cord (C4) ventral root (C4VR) inspiratory output activity and
the optical time series data in each pixel in the neonatal rat brainstem-spinal cord
preparation. In this method, by estimating the maximum correlation coefficient and
the lag at which the maximum correlation coefficient is given, functional charac-
teristics of the neurons in the two respiratory rhythm generators (RRGs) could be
clearly discriminated. Recently, Yoshida et al. [30] applied an independent com-
ponent analysis and correlation analysis to voltage-imaging data obtained from the
guinea pig brain, and found that ongoing and spontaneous activities in the auditory
cortex exhibit anisotropic spatial coherence extending along the isofrequency bands.
Although optical imaging with cycle triggered signal averaging has been widely
used as explained above, the ability of such evaluation is limited within grasping