Information Technology Reference
In-Depth Information
BG and the sequencing functions of SMA. This is our second prediction of changes
in neural processing with learning.
9.2.5 Simulation of the three Skill Learning Phenomena
and the two Brain Imaging Phenomena
9.2.5.1 The First and the Second Skill Learning Phenomena
Simulation results showed that the simulated interkey interval in the learning pro-
cess followed the power law of practice (
R
square
001). The simulated
interkey interval also improved from 385 to 180 ms, which was consistent with exist-
ing experimental data about performance changes from the unskilled typist (interkey
time 400 ms) with estimation error 3.75% (estimation error
=
0
.
8,
p
<
0
.
100%,
Y
:
simulation result;
X
: experiment result) to the skilled typist (177 ms interkey time)
with estimation error 1.69% (see Fig. 9.1).
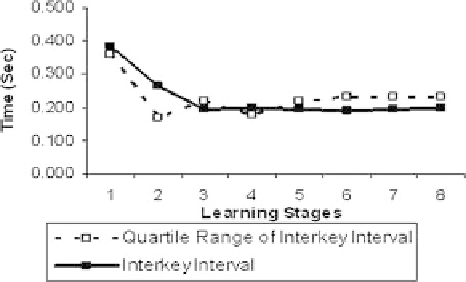
As shown in Fig. 9.2, the change of the quartile range (75% quartile-25% quar-
tile) is significantly correlated with the change of the simulated speed (
p
=
|
YX
|/
X
×
<
.
05),
which is consistent with the experimental results of Salthouse [41]. This was one of
the phenomena not covered by TYPIST [22].
0
Fig. 9.2: Simulated variability of interkey interval and interkey interval in the learn-
ing process. Each stage represents 352,125 keystrokes.
9.2.5.2 The Third Skill Learning Phenomena
The simulated tapping rate (interkey interval in typing repetitive letters) and typing
speed of text (interkey interval in typing multidigit sentence) during the learning
process were found to be strongly correlated (
p
05), which is consistent with
the experimental results of Salthouse [41] who found the significant correlation be-
tween the two variables (
p
<
0
.
01). Therefore, our model successfully modeled
these behavioral phenomena with very high accuracy.
<
0
.