Information Technology Reference
In-Depth Information
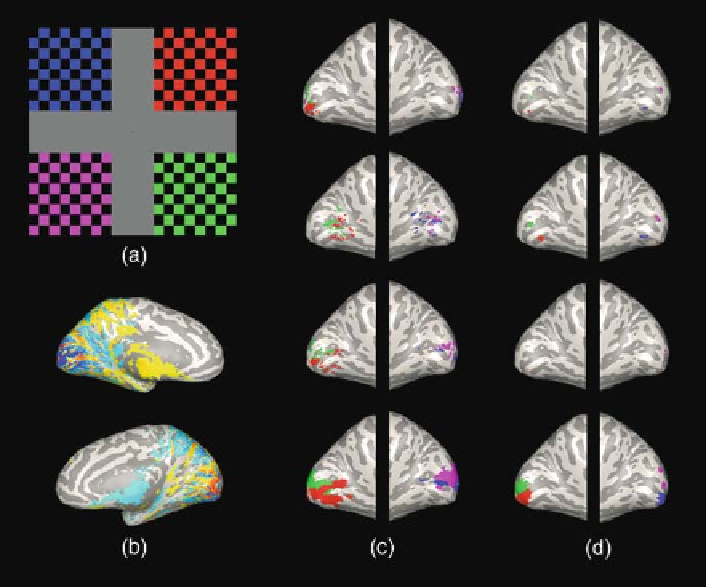
Fig. 8.1: Retinotopy of four visual quadrants. (
a
) Schematic of visual stimuli.
(
b
) Weighted minimum-
l
2
-norm estimate thesholded only at 0.1 of maximum. (
c
)
Retinotopic maps produced by distributed methods thresholded at 0.9 of maximum
(colors code for visual quadrant that maximally activated that area). (
d
) Retinotopic
maps produced by sparse methods. See Section 8.8.
cient. If one expects distributed sources, then distributed MAP estimation methods
(e.g., using a Gaussian prior, as in MNE, dSPM, or sLORETA), spatial scans, or
beamforming algorithms are appropriate. If one expects sparse sources, then SBL
or MAP estimation with a Laplacian or more super-Gaussian prior may better reflect
the true sources. If one expects compact distributed sources with variable levels of
spatial extent, then SBL or MAP estimation (with
p
≤
1) using a mixture model of
multiscale basis functions may be optimal.
It should be noted, however, that all of these methods are expected to reveal
somewhat similar functional brain maps for the same data set. If major discrepancies
in terms of the brain regions involved are evidenced, this should raise a warning flag
that some piece of the puzzle during source analysis has been misplaced higher up
in the long chain of treatments involved. Registration with MRI is a major source
of error, together with numerical errors in the computation of realistic head models
using the BEM or FEM.