Biomedical Engineering Reference
In-Depth Information
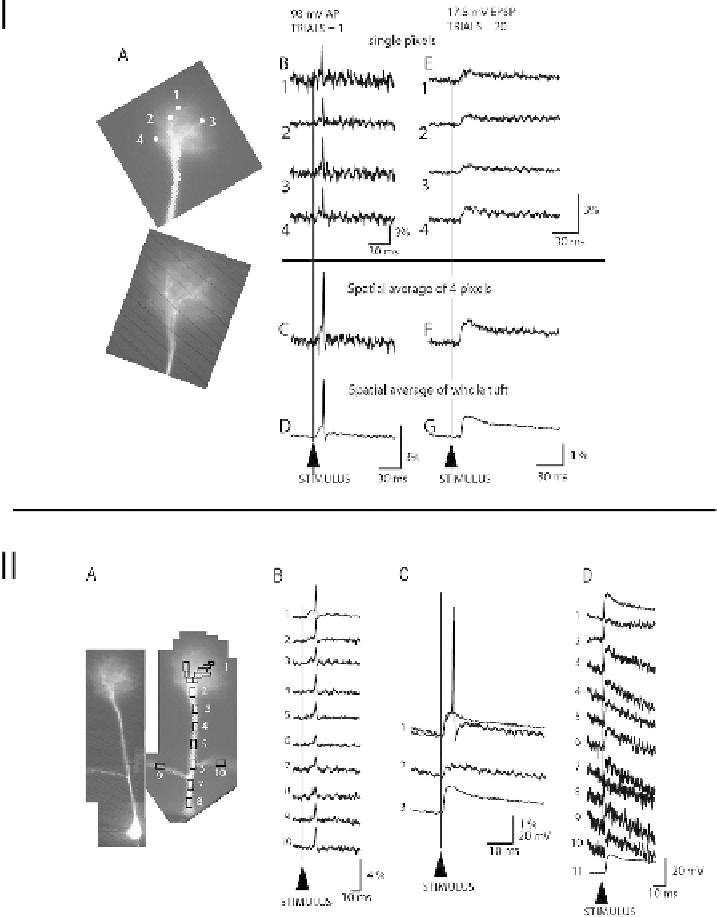
Fig. 3.4. Spatial resolution and sensitivity of voltage-imaging from neuronal processes. (
I
)(
A
) Low resolution (upper)
and high resolution (lower) image of the terminal dendritic tuft. (
B
) Recordings of action potential signals from 4
individual pixels/locations on the dendritic tuft in single-trial measurements (no averaging). (
C
) The signal-to-noise ratio
with spatial averaging of 4 pixels/locations from B. (
D
) The signal-to-noise ratio with spatial averaging of the entire tuft
area. (
E
) An evoked EPSP recorded from 4 individual locations on the dendritic tuft; 20 trials averaged. (
F
) Spatial average
of 4 pixels shown in E. (
G
) Spatial average of the entire tuft area. (
I
I) Attenuation of the EPSP along the primary dendrite.
(
A
) High and low resolution image of a mitral cell. (
B
) Single-trial optical recordings of action potential signals from
ten different regions on the primary and oblique dendrites. The rectangles indicate pixels that were averaged to obtain
traces 1-10. The amplitude of the action potential measured from the soma by a patch-electrode was 93 mV (resting
potential-to-peak). The amplitude of optical signals (
F/F) corresponding to a spike of constant size varied with the
location
(1-10)
due to unequal sensitivity of the optical measurement from different locations. The sensitivity profile,
determined from action potential measurements, provides a calibration for the conversion of optical signals to membrane
potential changes. In the measurements shown, the calibration factors (from the tuft to the most proximal part of the
primary dendrite) are: 1; 0.74; 0.56; 0.63; 0.53; 0.38; 0.40; 0.32 and 0.47 for the left and 0.59 for the right oblique