Biomedical Engineering Reference
In-Depth Information
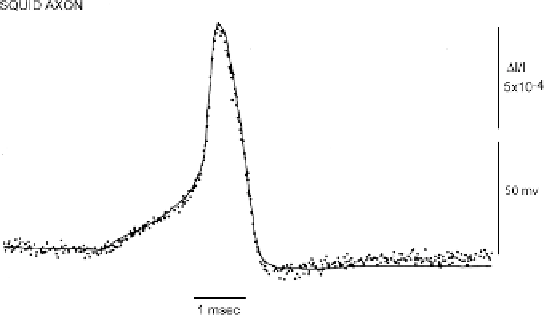
Fig. 3.1. Changes in absorption (dots) of a giant axon stained with a merocyanine dye,
XVII (
F
ig. 3.2), during a membrane action potential (smooth trace) recorded simultane-
ously. The change in absorption and the action potential had the same time course. In
this and subsequent figures, the size of the vertical line represents the stated value of
the fractional change in intensity of transmitted (
I/I), or fluorescent (
F/F) light. The
response time constant of the light measuring system was 35 μsec; 32 sweeps were
averaged. Modified from Ross et al.
(59)
.
The voltage-sensitive dye signals described in this chapter are
“fast” signals
(1)
that are presumed to arise from membrane-
bound dye; they follow changes in membrane potential with a
time course that is rapid compared to the rise time of an action
potential.
Figure 3.1
illustrates the kind of result that is used to
define a voltage-sensitive dye. In a model preparation, the giant
axon from a squid, these optical signals are fast, following mem-
brane potential with a time constant of
<
μ
sec
(2)
and their
size is linearly related to the size of the change in potential (e.g.
(3)
). Thus, these dyes provide a direct, fast, and linear measure of
the change in membrane potential of the stained membranes.
Several voltage-sensitive dyes (e.g.,
Fig. 3.2A
)havebeen
used to monitor changes in membrane potential in a variety of
preparations. This figure illustrates four different chromophores
(the merocyanine dye, XVII, was used for the measurement illus-
trated in
Fig. 3.1
). For each chromophore, approximately 100
analogues have been synthesized in an attempt to optimize the
signal-to-noise ratio that can be obtained in a variety of prepa-
rations. (This screening was made possible by synthetic efforts
of three laboratories: Jeff Wang, Ravender Gupta and Alan Wag-
goner then at Amherst College; Rina Hildesheim and Amiram
Grinvald at the Weizmann Institute; and Joe Wuskell and Leslie
Loew at the University of Connecticut Health Center.) For each
of the four chromophores illustrated in
Fig. 3.2
, there were
10 or 20 dyes that gave approximately the same signal size on
squid axons
(3)
. However, dyes that had nearly identical signal
size on squid axons could have very different responses in other
10