Biomedical Engineering Reference
In-Depth Information
t
= 0.6s
t
= 1.2s
t
= 1.7s
t
= 4.3s
t
= 6.6s
(A)
PME
(B)
Pi
PDE
(C)
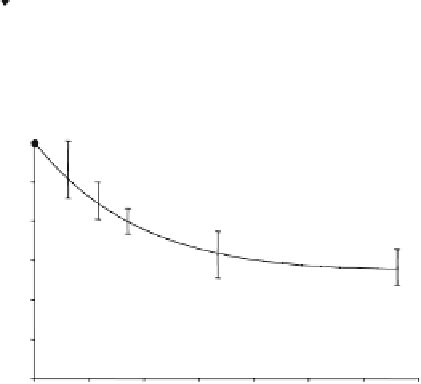
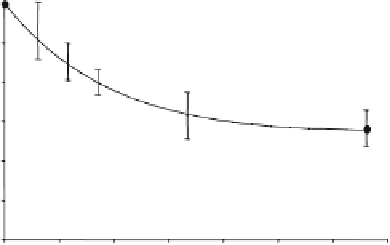
1.0
0.9
0.8
0.7
0.6
0.5
0.4
0.0
1.0
2.0
3.0
4.0
5.0
6.0
7.0
Saturation Time (s)
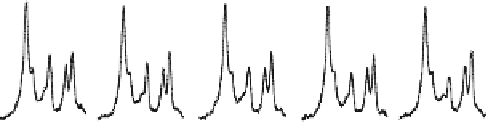
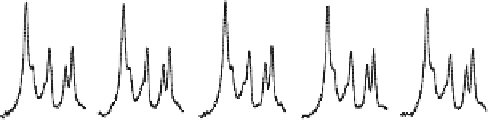
Fig. 15.10. (
A
) Progressive saturation measurements and averaged in vivo
31
P spectra
(partially displayed) as a function of γ-ATP saturation time (t), and (
B
) their corresponding
control
31
P spectra. The arrows point to the Pi resonance peak. (
C
) Normalized Pi signal
change as a function of t and regression fitting (solid line) according to
Eq. (15.13a)
.
Adapted from Lei et al. of Ref.
(20)
.
have been applied to physiological studies of ATP metabolism
in a variety of organs, from hearts to brains
(20, 24, 45, 46, 49,
50, 103, 105-111)
. Among these methods, the CST method is
most commonly used in biomedical research, perhaps due to
its methodological simplicity and high efficiency. This method
is particularly useful in measuring the forward rate constants
and fluxes in the chemical exchange system of
PCr
Pi
when a frequency-selective RF saturation pulse train is applied
to fully saturate the
↔
ATP
↔
γ
-ATP spin. Under this circumstance, the
three-spin chemical exchange system of
PCr
Pi
can be
treated as two independent two-spin chemical exchange sys-
tems (i.e.,
PCr
↔
ATP
↔
Pi
); consequently, the forward
rate constants and fluxes for both the CK reaction (i.e.,
R4
in
Figs. 15.1 and 15.13
)andATP
ase
reaction (i.e.,
R2
in
Figs. 15.1 and 15.13
) can be explicitly determined. These for-
ward metabolic fluxes reflect the ATP synthesis or production
rates catalyzed by ATP
ase
and CK, respectively. However, the
↔
ATP
and
ATP
↔