Biomedical Engineering Reference
In-Depth Information
PCr
(A)
α-ATP
PE
GPE
γ-ATP
NAD
PC
GPC
β-ATP
UDP
Pi
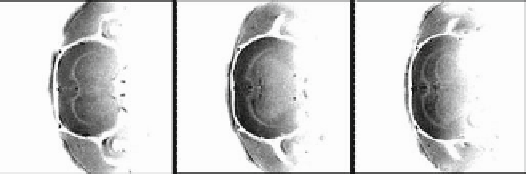
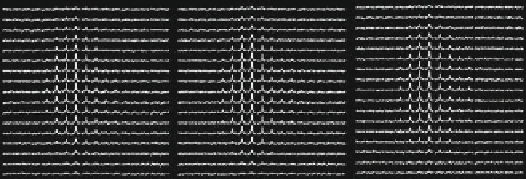
(B)
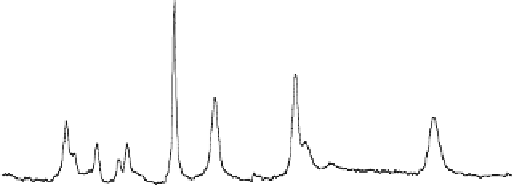
Fig. 15.2. (
A
)Atypical
31
P MR spectra acquired from the human occipital lobe at 7T
with a total sampling time of 6.4 minutes. The spectrum is characterized by excel-
lent spectral resolution and NMR sensitivity, and a large number of well-resolved reso-
nance peaks from phosphoethanolamine (PE); phosphocholine (PC); inorganic phosphate
(Pi); glycerophosphoethanolamine (GPE); glycerophosphocholine (GPC); phosphocreatine
(PCr); adenosine triphosphate (ATP); nicotinamide adenine dinucleotides (NAD) and uri-
dine diphospho sugar (UDP). Adapted from Lei et al. of Reference 24. (
B
)3D
17
O MRSI of
natural abundance H
2
17
O
(top row) and corresponding
1
H anatomical images (bottom
row) of rat brain acquired at 9.4T. The
17
O surface RF coil positions and cross sections
are indicated in the images.
biosynthetic enzymes
(26-29)
.Invivo
31
P MRS has been widely
applied to study both normal and diseased brains and has led to
a large number of publications (e.g.,
(19, 21-24, 26-28, 30-42)
.
The abnormality in the HEP metabolites has been frequently
observed in the diseased brains using in vivo
31
P MRS, and these
changes or the change of HEP concentration ratios have been
commonly applied in many clinical studies.
Although the steady-state concentrations of cellular HEP
metabolites are closely linked to the ATP metabolism, they are rel-
atively stable under normal physiological conditions. This could
be attributed to the rigorous regulation of the ATP metabolic
reactions and their kinetics (see
Fig. 15.1
) for maintaining sta-
ble chemical energy supply of ATP in the brain. This is likely
the case for the brain activation caused by brain stimulation and
task performance. Thus, the measurements of the kinetics of ATP