Biomedical Engineering Reference
In-Depth Information
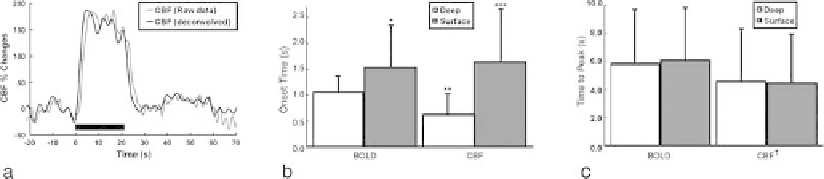
Fig. 13.5. Temporal response of CBF and BOLD fMRI signals. (
a
)Raw(gray) and deconvolved (black) CBF response
curves obtained using ASL at 108 ms temporal resolution during electrical stimulation of the rat forepaw. The raw CBF
curve was obtained at 9.4 T and was deconvolved with the tissue T1 decay curve to produce the true CBF response.
(
b
) Averaged onset-times of CBF and GE-BOLD at 9.4 T in the surface (gray bars) and deep (white bars) regions of the
somatosensory cortex. (*) The onset of the BOLD response in the cortical surface was significantly later than deeper
in the cortex (
P
<
0. 03
). (**) CBF changes in the deep cortex occurred earlier than the corresponding BOLD changes
(
P
<
0. 003
). (***) The onset of superficial CBF changes was significantly delayed compared to deep in cortex (
P
<
0. 004
). (
c
) Averaged time-to-peak of CBF and BOLD. There were no significant time-to-peak differences across regions
within either BOLD (
P
>
0. 28
) or CBF (
P
>
0. 39
). (
†
) However, the CBF peak response occurred faster than the BOLD
response in both regions (
P
<
0. 001
). Error bars = 1 std. dev. Adapted from ref. (27) with permission of Lippincott,
William & Wilkins., and from ref. 67 with permission of Wiley-Liss Inc., Wiley Publishing Inc., a subsidiary of John Wiley
&Sons.
can be used to obtain the BOLD functional changes so that this
more popular fMRI contrast mechanism can be directly compared
to the corresponding CBF changes.
Figure 13.5b
shows the onset time of BOLD and CBF in
the superficial and deep regions of the somatosensory cortex fol-
lowing the onset of stimulation. The onset of CBF changes in the
deep layers of the somatosensory cortex occurred earlier than the
corresponding BOLD changes (
P
0. 003)
(27)
. However, in
the superficial layers, the onset of the CBF response was delayed
and it was similar to the latency of the superficial BOLD signal
changes.
Figure 13.5c
shows the BOLD and CBF times-to-peak.
The CBF peak response occurred faster than the BOLD response
in both regions (
P
<
0. 001)
(27)
. The heterogeneity of fMRI
onset-times across the cortical depth layers is indicative of the
effects of the vasculature on the fundamental temporal character-
istics of the hemodynamic response, and makes a clear statement
that the resolution of fMRI is fine enough to resolve subcortical
activity and to study subcortical processes, such as columnar and
laminar cortical communication.
Indeed, the shorter onset times found with CBF in the deeper
layers of the cortex
(27)
were later confirmed with BOLD con-
trast obtained at higher spatial resolution
(28)
(Table 13.1). The
BOLD onset times obtained at high spatial resolution (200
<
×
m
2
) from layers IV-V in the cortex
(28)
were as fast as the
CBF onset-times obtained at a lower spatial resolution
(27, 67)
,
suggesting that the onset-time of the hemodynamic response is
faster than 600 ms and that improving the spatial resolution may
further shorten the onset latency. In the latter study, layer-specific
200
μ