Biomedical Engineering Reference
In-Depth Information
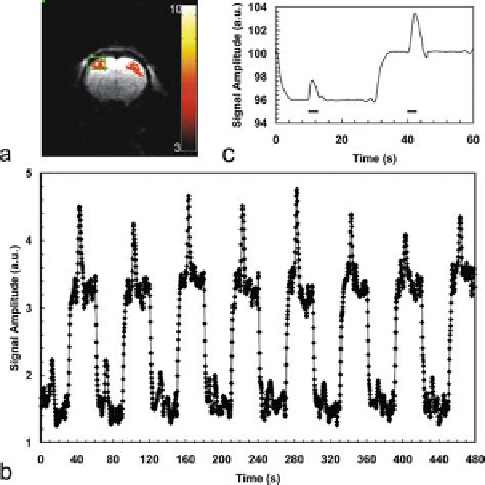
Fig. 13.4. Combined DASL-fMRI experiment. (
a
) t-score map of the BOLD functional
response to bilateral stimulation of the rat forelimbs. Robust activation regions are
present in both left and right primary somatosensory cortices. (
b
) Combined DASL-fMRI
time-course. The functional hemodynamic is superimposed on top of the DASL experi-
ment. (
c
) Data averaged into a single DASL cycle, obtained after fitting and filtering of
the DASL curve. Stimulation periods are indicated by the horizontal bars underneath the
hemodynamic response. The control phase of the DASL cycle displays a robust BOLD
response, while the labeling phase shows the mixing of the functional BOLD and CBF
contrast in anti-phase to each other.
cycle displays a robust BOLD response, while the labeling phase
shows the mixing of the functional BOLD and CBF contrast in
anti-phase to each other. Because functional increases in CBF lead
to signal decreases in ASL, the resulting functional signal changes
are smaller during the labeling half-cycles (when the BOLD con-
trast opposes the CBF contrast) than during the control half-
cycles (when contrast is due to BOLD alone). After fitting and
filtering of the DASL curve, the data was averaged into a single
DASL cycle, shown in
Fig. 13.4c
. The hemodynamic response
is superimposed on the DASL evolution. Stimulation periods are
indicated by the horizontal bars underneath the hemodynamic
response.
Once the CBF images are formed, analysis of the temporal
characteristics of the CBF response to functional stimulation is
desired. For this, a temporal deconvolution of the measured MRI
time-course becomes necessary, because instantaneous changes in
CBF cannot be quickly reflected in the MRI time-course. To show
this, consider the longitudinal tissue magnetization obtained after