Biomedical Engineering Reference
In-Depth Information
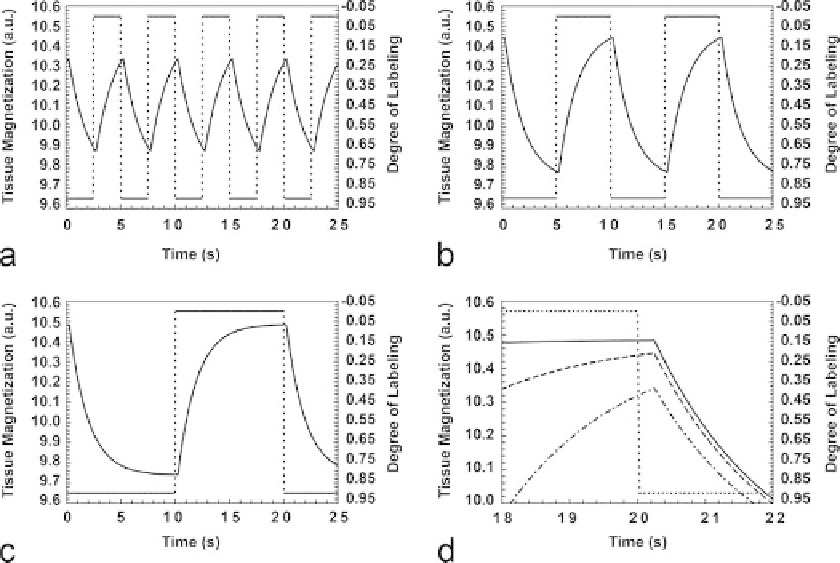
Figure 13.1 shows
the tissue response expressed by
Equa-
tion (13.10)
simulated for different frequencies of a square label-
ing function. As expected, the tissue response is shifted with
respect to the labeling function by the transit time
. Also, both
amplitude and the phase of the tissue response are modulated by
the labeling function. The phase modulation occurs due to the
way the labeling function alters the magnetization of the arterial
water flowing to the detection site, while the amplitude modu-
lation occurs due to how fast the labeled and unlabeled states
are switched when compared to the transit time and to the lon-
gitudinal relaxation rate. The DASL technique has the advan-
tages of allowing continuous repetition of the ASL experiment in
such a way that the tissue response can be analyzed to unravel
in a dynamic manner the three parameters of interest:
T
1
b
,
τ
τ
and CBF. Determination of these parameters can be accom-
plished with high sensitivity, because the labeling period 2
can
be made long enough so that the tissue response reaches steady-
state (e.g.,
Fig. 13.1c
) and, because the periodic nature of the
Fig. 13.1. Simulation of the tissue magnetization response to three different frequencies of the ASL function after steady
state has been reached using the following parameters:
T
1
app
=
1. 75
s,
τ
=
0. 25
s, CBF = 150 ml / (100 g · min)
and
α
0
=
0. 90
. Labeling frequencies of 0.20 Hz (
a
), 0.10 Hz (
b
) and 0.05 Hz (
c
) are shown. The dashed lines show
the labeling function (right-hand scales), and the dark lines show the corresponding tissue responses in arbitrary units
(left-hand scales). An expanded scale plot of the maximum amplitude reached in each situation is shown in (
d
). Note
that different labeling frequencies modulate the amplitudes of the tissue response, while the delayed tissue response is
independently governed only by the transit time
τ
from the labeling plane to the detection region.