Biomedical Engineering Reference
In-Depth Information
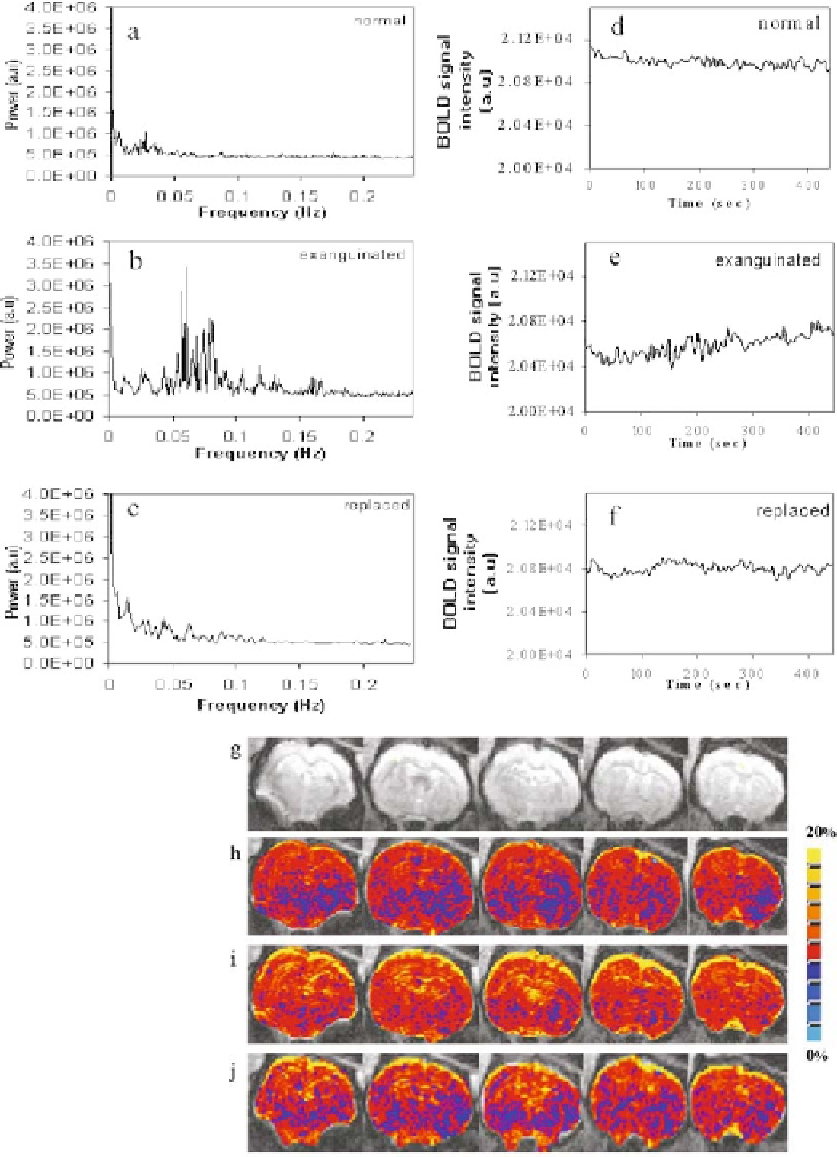
Fig. 12.1. Average power spectra of the BOLD signal, average filtered BOLD signal
time series and standard deviation of the BOLD signal from the whole brain in a typical
rat during normal, exsanguinated and blood replaced conditions. (
a-c
) average power
spectra (
d-f
) average filtered BOLD signal time series, (
g
) anatomy (
h-j
) BOLD signal
standard deviation maps during normal, exsanguinated and blood replaced conditions
respectively. (
See
Color Plate)