Biomedical Engineering Reference
In-Depth Information
A
B
ISI
1
sec
5
sec
30
sec
Fig. 11.7. Stimulation scheme. Two concentric rectangular frames were presented
with inter-stimulus intervals (inter-frame) of 0, 50 and 240-ms. Smaller one was shown
first, followed by larger one. The repetition time of paired stimuli, t1 is 1-s. The repe-
tition time of trials, t2 is 30-s. The rectangular frames were not spatially overlapped in
the display.
In each pair, the small frame was shown first, and after the ISI,
the large frame followed. One would expected them to be repre-
sented by the activation at various sites in the early visual areas,
and activation sites in the higher areas where shapes are recog-
nized would converge to the specific sites for the shape informa-
tion.
Pre-cognitive Shape recognition processes
A.U.
R
L
1.4
1.2
FG3
0
ms
>
240
ms
1
0
msc
50
msc
240
msc
0.8
FG2
0ms
>
50
ms &
240
ms
>
0
ms
FG1
0.6
VFG1
FG2
FG3
space
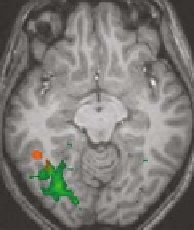
Fig. 11.8. Activation maps and trends of BOLD responses. Areas with positive
responses for the difference of 0 and 50-ms (orange). Areas with positive response
for the difference of 240 and 50-ms (green). FG1, FG2, and FG3 are areas in occip-
itotemporal region located at (30,-68,-9), (35,-57,-9), and (45,-46,-9). The responses
were normalized by the response to the 0-ms ISI at V1. (
See
Color Plate)