Biomedical Engineering Reference
In-Depth Information
A
B
C
L R
Left paw Right paw
P <0.0001
S1
FL
Trial 1
Rat 1
P <0.001
Trial 2
Rat 2
Trial 3
Rat 3
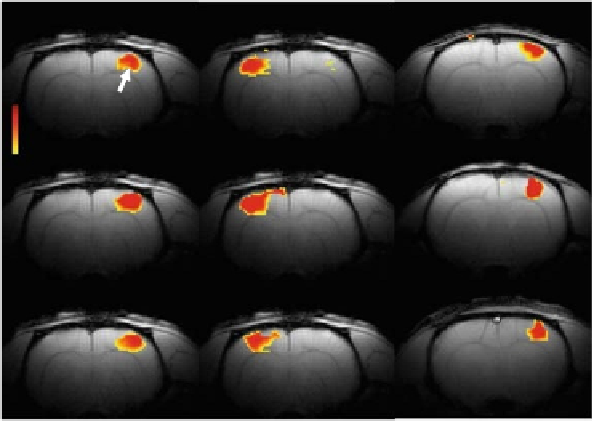
Fig. 10.7. BOLD responses from the contralateral forelimb area (
S
1
FL
) during 3 Hz
forepaw stimulation (0.3 ms pulses; 2 mA) in Sprague-Dawley rats. (
A
) Reproducibil-
ity of S1
FL
BOLD activation maps in the same subject during left paw and right paw
stimulations (see Trial column; left and middle) as well as other subjects (see Rat col-
umn; right). The t maps were generated by comparison of the mean signals from 30-s
baseline and stimulation periods. All data shown are from single trial runs. (
See
Color
Plate)
5s
30s
60s
300s
16%
16%
A
B
12%
12%
8%
8%
4%
4%
0%
0%
-4%
-4%
0
60
120
180
240
300
360
0
30
60
90
120
C
D
20
1.0
15
0.8
0.6
10
0.4
5
0.2
0.0
0
-0.2
-5
0
30
60
90
0
30
60
90
Time (sec)
Time (sec)
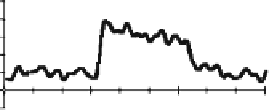
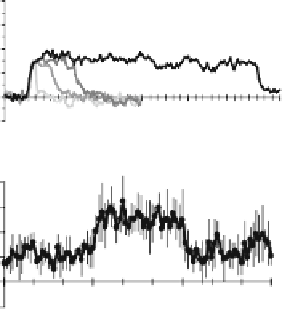
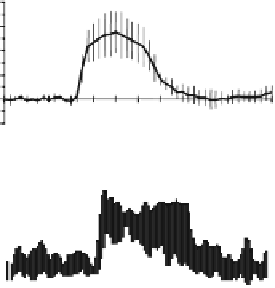
Fig. 10.8. Multi-modal responses from the contralateral forelimb area (S1
FL
) in Sprague-Dawley rats (0.3 ms pulses; 2
mA; 3 Hz). BOLD time courses from the S1
FL
are shown for (
A
) averaged during 30-s stimulation (n= 8) and (
B
) a single
subject where the stimulus duration was varied (5-300 s). The averaged time courses from the S1
FL
are shown for (
C
)
CBF (n = 5), and (
D
)MUA(n = 5). The stimulation period is indicated by the black bar. Vertical bars or gray shading
represent standard deviations from the mean.
BOLD response in the contralateral S1
FL
(data not shown),
which is in good agreement with prior observations
(63-65)
.
Localized S1
FL
measurements of CBF (
Fig. 10.8C
)andMUA
(
Fig. 10.8D
) were well correlated with the fMRI results.