Biomedical Engineering Reference
In-Depth Information
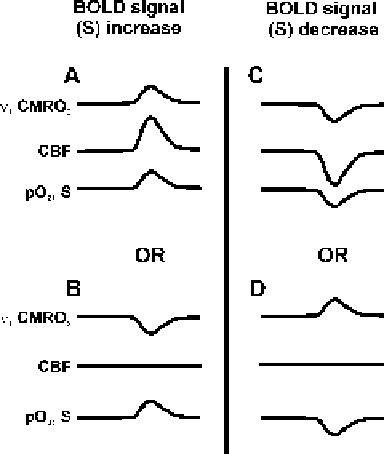
Fig. 9.2. Schematic representation of increases and decreases in the BOLD signal (S)
as a result of possible changes in neuronal activity (ν), CMRO
2
, cerebral blood flow
(CBF), and tissue oxygenation (PO
2
). (
A, B
) Examples of changes leading to increases in
the BOLD signal. (
C, D
). Examples of changes leading to decreases in the BOLD signal.
Note: Relative changes among ν,CMRO
2
, CBF, and PO
2
, S are not drawn to scale but
are exaggerated for illustrative purposes. (Reprinted with Permission from Blumenfeld,
2007,
Epilepsia (93)
).
4.1. Increases
FMRI signal changes, resulting from changes in neuronal activ-
ity, must be interpreted cautiously due to the complexity of
the underlying mechanisms contributing to the BOLD signal.
Positive changes in the BOLD signal can result from two dif-
ferent mechanisms (
Figs. 9.2A, B
): (i) Increased neuronal activ-
ity (
)andCMRO
2
, accompanied by sufficiently increased CBF
and oxygen delivery to exceed metabolic demands, which leads
to increased pO
2
and S (
Fig. 9.2A
), or (ii) Decreased
ν
and
CMRO
2
, with no change (or minimal decreases) in CBF, so that
oxygen delivery again exceeds metabolic demands, leading to an
increase in pO
2
and in S (
Fig. 9.2B)
. Although increased BOLD
signal is usually thought to reflect
increases
in neuronal activity
(14, 55, 56)
, BOLD signal increase may also accompany
decreased
neuronal activity (if CBF does not change, or does not decrease
sufficiently to reduce net oxygenation). Similarly, BOLD increases
without changes in neuronal activity are possible if CBF is abnor-
mally increased
(57)
.
ν
4.2. Decreases
Like BOLD increases, BOLD decreases can reflect either
decreases or increases (or no change) in neuronal activity
(
Figs. 9.2C, D
), depending on the direction and magnitude of
CBF changes. Usually, fMRI decreases are interpreted as
decreased