Biomedical Engineering Reference
In-Depth Information
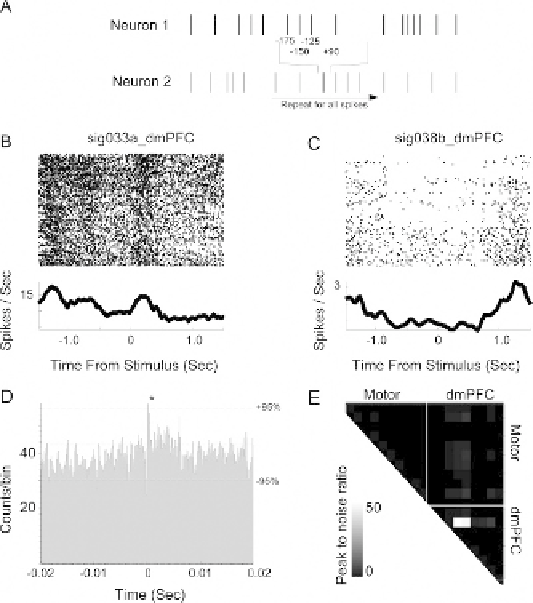
Fig. 7.4. Cross-correlation analysis between neurons in multi-electrode data. (A) In
cross-correlation, for each spike train, the distance (in time) to every other spike of
another spike train is recorded, and then a histogram constructed of distances in time
of one spike in relation to another spike. (B) and (C) Peristimulus rasters for two dmPFC
neurons; both neurons become inhibited prior to lever press, and recover firing rates
after the lever is released. (D) These neurons have a strong, monosynaptic connec-
tion ∼2-4 ms, suggesting they are connected or coactivated. These neurons are ∼250
μm distant. (E) Cross-correlation across our ensemble of dmPFC and motor cortex neu-
rons; the ratio of cross-correlation peaks to peaks in trial-shuffled data are plotted (this
metric is used to rapidly look across a population of cells). Note there are few strong
cross-correlations.
reasons, in our group we are hesitant to perform cross-correlative
analysis between two neurons on the same wire.
To perform cross-correlations between spike trains from two
neurons, one should:
1. Bin two spike trains of interest at 1 ms bins
2. Select one spike train as a reference spike train. For each spike
in this spike train, determine the time latencies of spikes in
the reference spike train to spikes of the other spike train.
Typically, time latencies larger than
200 ms are not of inter-
est for synaptic interactions, greater than 200 ms may indicate
slower interactions.
3. Once latencies are collected, the cross-correlation is simply the
histogram of latencies.
∼