Biomedical Engineering Reference
In-Depth Information
repeat shuffles many times, and compare functional interactions
of interest with functional interactions derived from trial- or
time- shuffled data. When running the same functional interac-
tion analysis over many pairs of neurons, one must consider how
to approach multiple comparisons. At a p
0. 05, 1 in 20 interac-
tions will be significant according to chance. One option is to use
a simple correction for multiple comparisons (such as the Bonfer-
onni correction). Alternatively, one can compare the number of
functional interactions above a significance level to the number
expected by chance via a X
2
test.
<
4. Functional
Grouping by
Principal
Component
Analysis
In exploring functional interactions, the first step is to identify
neurons with similar response properties. This can be achieved
rapidly via techniques such as principal component analysis
(PCA), a standard linear transform that uses singular value
decomposition to project multivariate data on a series of axes (or
components) to minimize their co-variance (
Fig. 7.3A)
.Touse
PCA, one should:
1. Arrange perievent histograms from neurons of interest into a
matrix where rows are neurons and columns are bins.
2. Apply SVD to generate components.
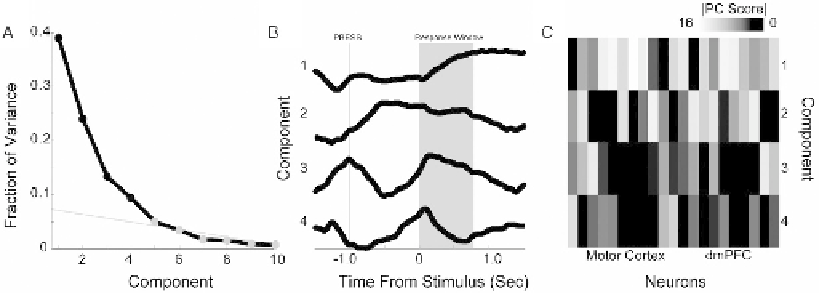
Fig. 7.3. Functional groups identified by principal component analysis (PCA). After peristimulus time histograms are
extracted, PCA is run to generate a series of components that minimize variance. (A) Scree plot fraction of variance
explained by each component. Statistical methods or line-fitting can be used to determine significant components in an
automated way; here, we selected four components by eye. (B) Components as a function of time plotted over the trial
in relation to stimulus onset on correct trials only. Note that lever press happens 1.0 s prior to the stimulus, lever release
occurs 0-0.6 s after the stimulus (mean 0.28 s), and reward acquisition occurs 0.1 s after lever release. Component
1 seems to be response-related; component 2 seems to be related to holding the lever down; component 3 seems to
be related to lever press and release movements, and component 4 seems to be involved in stimulus anticipation. (C)
Components projected onto recorded neurons from motor cortex and dmPFC. Note that strong components (
>
10
) tend
to occur on multiple neurons, suggesting common response properties across the population. Absolute value plotted -
we are interested in only the strength of the scores.