HTML and CSS Reference
In-Depth Information
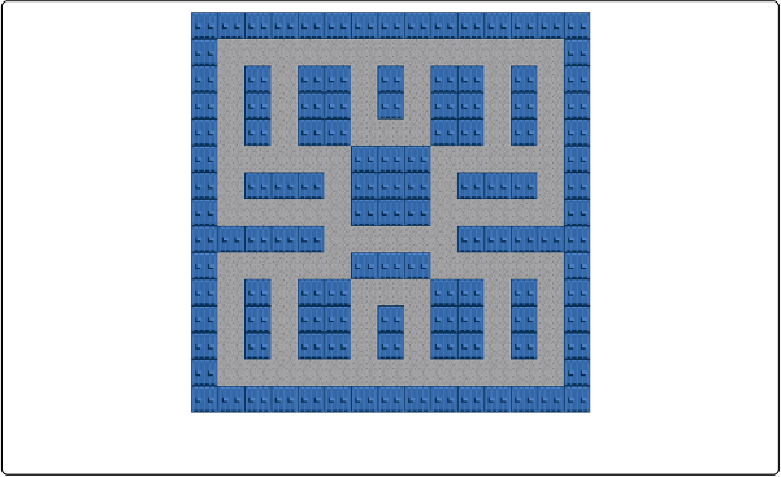
Figure 8-13. The
Example 8-14
15×15 tile map with no path finding applied
Along with changing the map data for
Example 8-14
,
we will also be adding new start and
end nodes to reflect the larger map size. Let's choose a start node of row 4, column 1, and end
nodeofrow13,column10.Thiswouldrequireustomakechangestothenew
startNode
and
endNode
variables. The changes for
Example 8-14
are simple, but they will create this larger
map and provide a better demonstration of the capabilities of the
graph.as
and
astar.js
func-
tions:
In
Example 8-14
we will demonstrate what happens when we increase the size of the
Example 8-13
tile map and run the A* functions. The following code shows the changes to
the
startNode
and
endNode
for this larger tile map.
//Example 8-14 startNode and endNode
var
var
graph
=
new
new
Graph
(
tileMap
);
var
var
startNode
=
{
x
:
4
,
y
:
1
};
// use values of map turned on side
var
var
endNode
=
{
x
:
13
,
y
:
10
};
If you make all of the changes to
Example 8-13
listed previously, the result will be
Example 8-14
.
The result of
Example 8-14
is shown in
Figure 8-14
.