HTML and CSS Reference
In-Depth Information
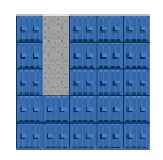
that the second column is made up of the number
1
in the first three rows. When displayed
on the canvas (without including the path finding code from
Example 8-13
)
, it will look like
map when we use and evaluate the data that comes back from the
astar.js
functions.
Figure 8-10. The
Example 8-13
tile map with no path finding code applied
The goal of
Example 8-13
is to use this very simple tile map with only three movable tiles to
show an example of how the
astar.as
and
graph.as
functions work to find a path of nodes.
The first task is to create a new
Graph
object from the prototype code in the
graph.as
file. We
dothisbypassingatwo-dimensionalarrayintotonew
Graph()
constructorfunction.Asmen-
tioned earlier, the problem is that the
Graph
prototype is looking for columns of rows rather
thanrowsofcolumns.Therefore,whenwecreatethe
startNode
and
endNode
objectsthatare
used by
astar.js
, we need to flip our idea of the tile map on its side and pass in the values as
if the tile map was set up in this manner. (Again, simply swapping the
x
and
y
values will do
the trick.)
//set up a* graph
var
var
graph
=
new
new
Graph
(
tileMap
);
var
var
startNode
=
{
x
:
0
,
y
:
1
};
// use values of map turned on side
var
var
endNode
=
{
x
:
2
,
y
:
1
};
for our tile map are simply swapped for use with
astar.js
.