Information Technology Reference
In-Depth Information
We call an embedding using the pair (
N
,
ND
) with group size
N
, embed-
ding rate
R
, and the expected distortion
D
exp
optimal if all other embedding
with the same group size
N
have rate
R
′ ≤
R
or distortion
D
′
exp
≥
D
exp
. Table 10.6
gives the optimal parameters (
N
,
ND
) of the DM allocation function. Group
sizes that are too small will generate capacity that is too small. Although
larger group sizes generally achieve a larger capacity, the number of pixels
will cause a decrease in embedding rate. We have also observed that ternary
embedding is a special case of the proposed method with the parameters
(1, 1) of the DM allocation function.
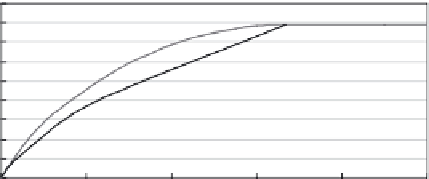
Figure 10.5 plots our theoretically achievable upper bound on the rate-
distortion pair (
R
,
D
exp
) = (2 1og
2
3
q
/(3
q
- 1), 2/3
q
) together with the upper
bound on the rate-distortion function. Although for a given distortion our
rate-distortion result is smaller than the bound on the rate-distortion func-
tion, it can be seen that the difference is very small for small distortion levels.
Moreover, we can approach the upper bound of the rate-distortion function
when our rate-distortion pair is (
R
,
D
exp
) = (log
2
3, 0.67).
The goal of message embedding is to design schemes with a high embed-
ding efficiency; that is, a high embedding rate but low change density. Thus,
we compare the performance of the proposed method, LSB embedding and
ternary embedding. The comparison results, given in Figure 10.6, show that
the proposed method is more efficient than the LSB embedding, and is fur-
thermore close to the bound in embedding efficiency given by Willems and
van Dijk [13]. From Figure 10.6, we can see that the embedding rate decreases
with increasing embedding efficiency. Note that when (
N
,
ND
) = (1, 3), both
the proposed method and ternary embedding provide the same family of
schemes, which can embed log
2
3 bits of messages into one pixel with 2/3
TaBLe 10.6
Optimal Parameters (
N
,
ND
) of the DM Allocation Function
N
1
4
13
40
121
364
1,093
3,280
9,841
ND
3
9
27
81
243
729
2,187
6,561
19,683
1.8
1.6
1.4
1.2
1
0.8
Bound
Bound of proposed method
0.6
0.4
0.2
0
0
0.2
0.4
0.6
0.8
1
Distortion
Figure 10.5
Theoretically achievable upper bound on rate-distortion function.