Information Technology Reference
In-Depth Information
in an upright position, and then heard test sounds and answered in their
positions. The number of test sounds ranged from 1 to 5, and 125 trials were
carried out in total. Here, eight-second long instrumental music segments
(piano, bass, hihat cymbal, snare drum, and synthesizer) were prepared for
the experiments.
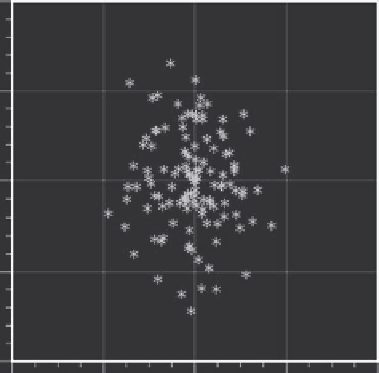
We examine the performance in terms of mobility of sound object(s).
Figure 8.7 shows the error distribution where the simulated sound position
is stable and does not change during the trial. Horizontal and vertical axes
represent error rates in horizontal and depth directions, respectively, where
their values are normalized by the distance between two adjacent speakers.
That is, the value 1.0 means that its error is equal to the distance between
speakers (i.e., 24 cm). In summary, the average error in horizontal direction
is 0.27 (6.5 cm) and that in depth direction is 0.42 (10.0 cm) [23].
Figure 8.8 shows the error distribution in the case when the position of
simulated sounds moves. The average error in horizontal direction is 0.52
(12.5 cm) and that in depth direction is 0.72 (17.3 cm).
As seen in the figures, in both cases, the performance in depth direction is
worse than that in horizontal direction. This is natural since we have ears at
both sides of our head. And in the case when sounds move, subjects found
difficulties in identifying their positions. In fact, the error distribution is
rather sparse.
2
1
0
-1
-2
-2
-1
0
1
2
Errors in horizontal direction
Figure 8.7
Distribution of errors (no sound position movement). (From Nakaie, T., Koyama, T., and
Hirakawa, M.
Development of Collaborative Multimodal System with a Shared Sound Display
, 14-19,
2008. With permission.)