Information Technology Reference
In-Depth Information
S1
S2
S3
S4
S5
S6
S7
S8
S9
S10
P1
P2
P3
P4
P5
P6
P7
P8
P9
P10
T6
T10
T9
T1
T4
T8
T3
T2
T5
T7
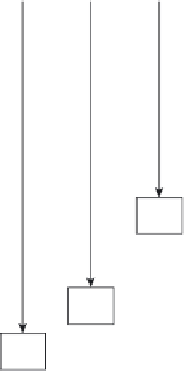
Figure 5.6
All tasks are scheduled according to ASAP with one transmission accepted by BS at a time.
and
y
-axis represents the sensors' tasks. The three gray-scaled colors (black,
light gray and dark gray) represent the sense, process, and transmit tasks
respectively.
5.6 Conclusion and Future Work
In this chapter, we introduced a novel data-aggregation model for wire-
less sensor networks. The new model combined all tasks within the wire-
less sensor network into a STFG, and then we utilized two scheduling
algorithms (ASAP and ALAP) to determine the best workload on the base
stations.
We are following two tracks in future work. The first track is a theoreti-
cal one, which is to find out if our model of data aggregation can be scaled
up for a large wireless sensor network. The second track is a practical one,
which comprises of experimenting with many base stations with different
capacities.