Geology Reference
In-Depth Information
13
C(
‰
)
(a)
δ
18
O (‰)
(b)
0
1.0
2.0
3.0
4.0
5.0
−
2
−
1.8
−
1.6
−
1.4
−
1.2
−
1
−
0.8
−
0.6
−
0.4
−
0.2
0
0
0
1
1
2
2
3
3
4
4
T7, 6.84
14
C kyr BP
G5, 8.77
14
C kyr BP
L5, 7.80
14
C kyr BP
T4, 6.40
14
C kyr BP
L6, 7.55
14
C kyr BP
G7, 8.47
14
C kyr BP
5
5
6
6
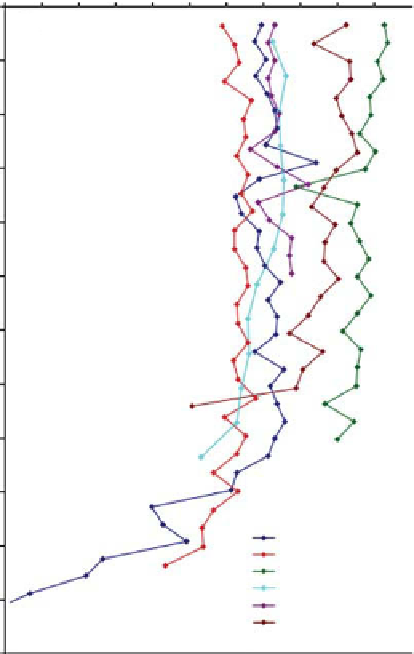
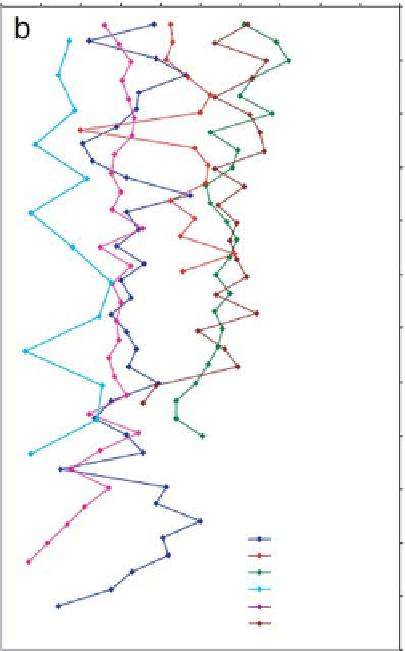
Fig. 4.
C-O isotopes of sediments along Holocene lagoon cores, Belize platforms. Basal
14
C ages of carbonate sediments of
individual cores are shown in the lower right corner. For location and description of cores see Gischler (2003).
13
C values. Very low values at core bases
correlate with diagenetic alteration close to
deposits of the meteoric realm (soil, altered reef
limestone), which usually are characterized by
light
higher
plot between
0.8% (Fig. 5). As in the
platform samples, there is no clear separation of
samples with regard to carbonate facies, however,
non-skeletal grains are among the heaviest mea-
sured with regard to carbon isotopes.
A number of statistically signifi cant correla-
tions exist between carbon and oxygen isotopes
and abundance of constituent grains such as coral,
foraminifera, non-skeletal grains and
Halimeda
(Table 5). The
3.2 and
13
C values (Allan & Matthews, 1977). Above
the meteorically infl uenced zone, i.e., above 4 m
depth,
13
C values of individual cores fl uctuate
only slightly, up to 1.2%. The
13
C of cores L5
and G7 exhibit considerably higher values as com-
pared with the other cores. These cores also have
a high abundance of
Halimeda
(Gischler, 2003).
The values of
18
O values also correlate with
the amount of the fi ne grain-size fraction and
with water depth. The
18
O range from
18
O values also exhibit a
statistically signifi cant negative correlation with
aragonite content.
1.9 to -0.6‰
13
C, there are mostly trends
towards higher values up-core as a consequence
of diagenesis, as discussed above. Again, cores L5
and G7 show higher values than observed in the
other cores.
(Fig. 4b). As with
Rasdhoo and Ari Atolls, Maldives, Indian Ocean
Stable isotope values range from +0.5 to +3.2% for
18
O, respectively
(Fig. 6). It is not possible to distinguish facies
based on isotope values. Only the mudstone facies
samples plot in a relatively narrow fi eld.
13
C and from
2.9 to
1.4% for
Belize Barrier Reef, Caribbean Sea
13
C
Within the barrier reef and shelf samples,
18
O values
values range from
1.5 to +4.7%. The