Geology Reference
In-Depth Information
relative to their total thickness. It is expected,
when utilizing the fi xed-interval sampling tech-
nique that lithofacies exhibiting average thick-
nesses at or less than the average for the entire
succession to be under sampled. Indeed this is
found to be the case for both wackestone (0.39 m)
and packstone (0.24 m) facies. Interestingly, how-
ever, the grainstone facies is also thinner than the
outcrop average (0.22 m) but is actually overrepre-
sented relative to its total thickness. Two factors
lead to this observation: fi rst, grainstones make
up over 20% of the total number of observed beds
but only 9% of the total thickness and second,
grainstones are texturally distinct on a weath-
ered outcrop and are therefore less likely to be
misidentifi ed. Thus, the probability of inclusion
in a dataset composed of equally spaced samples
of lithology is controlled by both the thicknesses
of the occurrences of the lithology as well as its
recurrence frequency in the section.
In the case of the Ordovician study (Wilkinson
et al.,
1997), the choice of the sampling inter-
val size was driven by an observed stratigraphic
characteristic, average bed thickness. Additionally,
because the technique used was the direct resam-
pling of the outcrop, there were limitations associ-
ated with the collection of this primary lithological
data. That is, resampling at shorter stratigraphic
intervals, while possible, was impracticable given
the vast thickness exposed at the Ardmore out-
crop. Without question, this technique would not
be considered ideal for quantitative analysis of
spatio-temporal characteristics due to the relat-
ively broad spacing between successive samples
(0.38 m) but it does provide an interesting example
of how interval sampling of an outcrop can result
in a different understanding of the stratigraphy
than does a traditional boundary measuring tech-
nique. Conversely, the analysis of the Latemar
section (Preto
et al
., 2001) utilized a very small
(0.5 cm) secondary resampling interval for the
collection of a proxy data series.
Within the Cimon del Latmar section, 161 of
the 472 recognized lithological units are vadose
altered dolostones and caliche soils, a facies that
is equivalent to the vadose diagenetic cycle caps
of Goldhammer
et al.
(1987, 1990). Representing
intervals of platform exposure, this facies
provides the most reliable measure of relative
accommodation space of the four subfacies rec-
ognized by Preto
et al.
(2001). The stratigraphic
distribution of Facies 1 throughout the Cimon del
Latemar section is found to be fairly uniform, as
might be expected for a facies that makes up over
0.35
Kindblade and West Spring Creek formations, Ordovician, Oklahoma
0.30
Frequency of occurrence (2161 observations)
Fraction of total thickness (819 m)
0.25
0.20
0.15
0.10
0.05
0
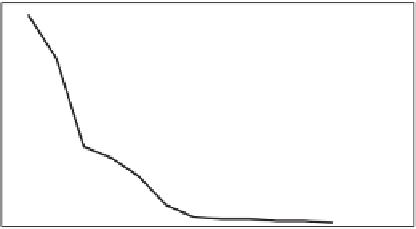
Fig. 2.
Distribution of relative abundance of the 14 facies
types identifi ed by Wilkinson
et al.
(1997) in the Lower
Ordovician Kindblade and West Spring Creek Formations
along Interstate 35 in the Arbuckle mountains north of
Ardmore, Oklahoma, USA. The fraction of total thickness
was determined using standard section measuring tech-
niques by summing the thicknesses of all occurrences of a
given facies. The frequency of occurrence was calculated as
the number of times that facies was identifi ed when the
section was measured a second time using a fi xed interval
observation technique.
discrete facies rank technique and its results.
The fi rst and most obvious question relates to the
selection of a vertical sampling interval
t
. In a
study of the recurrence characteristics of per-
itidal carbonate facies in the Lower Ordovician
Kindblade and West Spring Creek Formations,
Wilkinson
et al.
(1997) carried out detailed
section measuring along Interstate 35 in the
Arbuckle mountains north of Ardmore, Oklahoma.
In this study, 2161 lithologically distinct beds
were identifi ed in 819 m of continuous section by
standard section measuring procedures. Fourteen
lithostratigraphic units were recognized in this
succession. Subsequently, the outcrop was remeas-
ured in the fi eld utilizing a discrete sampling
methodology where lithological composition was
determined by direct observation every 0.38 m
up-section throughout the succession. This sam-
pling interval was derived from the average thick-
ness of the 2161 beds measured using standard
section measuring techniques. These two tech-
niques produce similar, albeit not identical,
results (Fig. 2). Using the discrete sampling
method, micrite and grainstone facies are slightly
overrepresented relative to their percentage of the
total stratigraphic column thickness, while pack-
stone and wackestone facies are underrepresented