Geology Reference
In-Depth Information
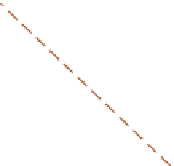
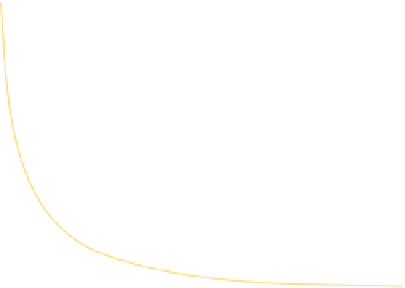
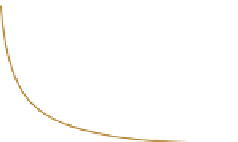
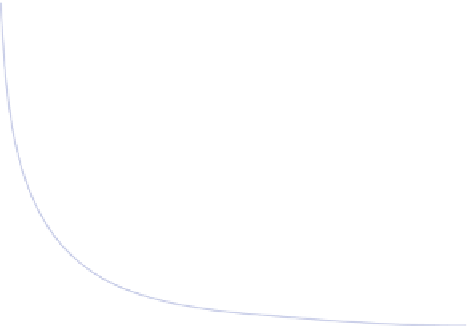
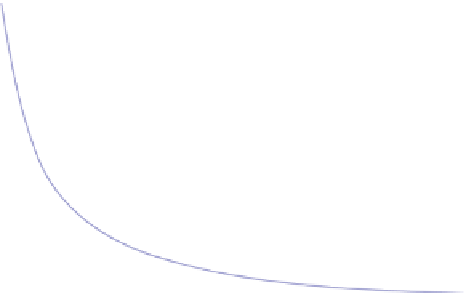
Curves: fall*erosion = constant (hyperbola-like)
Dots: boundaries by modelling
Production (
Fig. 8.
Three-dimensional para-
meter space illustrating stability
domains of FST and STM. (a) Plane
defi ned by rate of sea-level fall and
rate of erosion. Coloured dots: FST/
STM boundaries determined by
modelling; colour indicates rate of
carbonate production (see code at
upper right). Boundaries of FST and
STM domains resemble hyperbolas
centred on the origin. Coloured
lines are best-fi tting exact hyperbo-
las of type
x
(a)
1000
m yr
−
1
)
μ
10000
7000
800
5000
3000
2000
600
1000
500
400
STM
y
= constant. Green
box: outer limit of geologically
probable space. (b) Bi-logarithmic
plot of sea-level/erosion plane of (a).
Linear trends of FST-STM bound-
aries confi rm their nature as power
functions approaching hyperbolas;
however, slopes of regression
lines vary and differ from 1; lines
also bend near the ends, probably
because of limited spatial and tem-
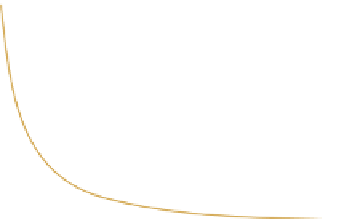
poral resolution of the models. (c)
Cross plot of rate of production ver-
sus product of rates of sea-level fall
and erosion; coloured stars may be
viewed as intersection points with
boundary hyperbolas in (a). The
FST-STM boundary in this plane
is parabola-like but the exponent
is smaller than 2. Green arrows
indicate that geologically probable
space in this plane extends beyond
limits of graph.
200
FST
0
0
10000
20000
30000
40000
m yr
−
1
)
Sea-level fall (
μ
(c)
(b)
10*10
3
2.5
x
1.28
y = 0.000037
×
8*10
3
2.0
Slopes of
regression
lines
6*10
3
1.5
−
1.27
4*10
3
−
1.10
FST
−
1.10
−
1.04
1.0
2*10
3
−
1.01
−
1.19
STM
−
1.40
0.5
0
1*10
6
2*10
6
3*10
6
4*10
6
3.0
3.5
4.0
4.5
0
m yr
−
1
)
m
2
yr
−
2
)
log (Rate of fall) (
μ
Rate fall * rate erosion (
μ
geometry. Ages of the relevant seismic refl ectors
are suffi ciently well constrained to estimate rates
of fall.
The Miocene of Mallorca in the Mediterranean
is well known from detailed studies of sea cliffs
and numerous water wells (Pomar, 1991, 2000).
The rocks are well dated by biostratigraphy.
These dates and the close match between observa-
tion and forward modelling (Bosence
et al
., 1994)
support the orbital interpretation of the platform
cycles advanced by Pomar (1991). The orbital
interpretation of cycles and the clearly observed
ranges of sea-level fall in outcrop provide narrow
constraints on the rates of sea-level fall.
Rates of subaerial carbonate erosion were
taken from the data on extant systems in White
(1984): warm temperate settings 60-125
m yr
1
(assumed to apply to Nijar and Mallorca); wet
tropical settings 90-200
m yr
1
(assumed to apply
to Maldives, Bu Hasa, Safah and Habshan). The
rates in White (1984) were measured over time
spans of months to years. In the case studies, the
time spans for forming the FST are in the range of
10
3
-10
5
yr. Gardner
et al
. (1987) have argued that
erosion rates, like sedimentation rates, decrease
with increasing length of the time window and
presented a quantitative estimate of this scal-
ing trend based on eight orders of magnitude in
time. In this study, the scaling of erosion rates is
accepted as a possibility but not as a certainty.
This increases the uncertainty of the rate estimates
and the range of erosion rates in Fig. 16 refl ects
this situation. The upper limit of the range
bars is drawn by assuming that the rate scaling
does not apply and the maximum rates in White
(1984) remain valid guesses also for the long time
Case studies in FST parameter space
Figure 16 shows the case studies in the plane
of erosion versus sea-level fall of the parameter
space established by modelling (Fig. 8a). The
rates of erosion and sea-level fall with their error
bars were derived as follows.