Geology Reference
In-Depth Information
(a)
(c)
0.6
0.5
1
0.5
5:1
0.8
2.7:1
2.4:1
1
Δ
f
12:1
9:1
3.2:1
18.9:1
8.5:1
0.4
0.6
5:1
β
95%
0.3
6
90%
0.4
2.2:1
0.2
Δ
f
5.5
0.2
0.1
β
0
0
5
(b)
(d)
180
0.6
0.5
5.1:1
135
+45
+
3
3.1:1
°
°
0.5
9.8:1
Δ
f
90
1
+20
°
+
10
°
+14
°
+
15
°
2.4:1
27:1
0.4
45
β
0.3
0
6
45
−
0.2
90
Δ
f
−
5.5
−
40
°
+
10
°
0.1
−
135
β
−
180
0
5
0
0.1
0.2
0.3
0.4
0.5
Cycles/unit
Cycles/unit
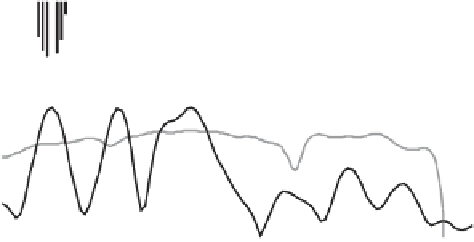
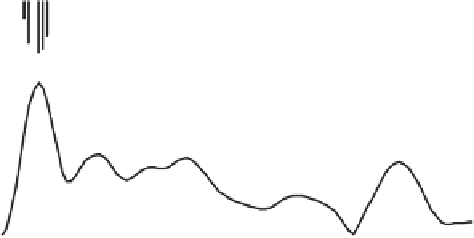
Fig. 9.
The Multitaper Method spectral analysis of the Mendola and Latemar cycle thickness series using three 2
multitapers (orders 0, 1 and 2) with adaptive
weighting (Thomson, 1982). Both series have been zero-padded from their initial length of 36 to 500, resulting in interpolated spectra with 250 estimated dimension-
less frequencies. However, the elementary sampling frequency remains at
f
=0.083 (see
horizontal lines). Harmonic analysis of (a) Mendola series and (b) the Latemar series. For both (a
)
and (b
)
, the black curves are the line (or amplitude, or fi rst moment)
spectra, and refer to the
y
-axis to the left; the grey lines are effective degrees of freedom (or adaptive weighted d.o.f.), and refer to the
y
-axis on the right (bottom).
The bars descending from the top are
F
-test results for the lines, reported as signifi cance (50-100%), and refer to the
y
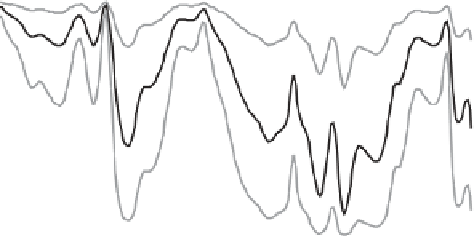
-axis on the right (top). (c) Magnitude-squared
coherency spectrum of the Mendola versus Latemar series. The horizontal dashed lines labelled 90% and 95% indicate signifi cance levels for zero coherence for
Magnitude-squared coherency estimates of normally distributed variables with 5 d.o.f. (Carter
et al
., 1973). The black curve gives the estimated Magnitude-squared
coherency values, corrected for the statistical bias imposed by 5 d.o.f. (Carter
et al
., 1973); the grey curves indicate the 95% confi dence limits. Labels indicate bundling
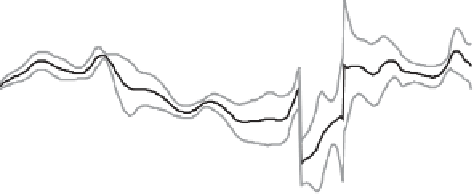
components at frequencies with lower than 95% confi dence limits exceeding the 95% level of zero coherence. (d) Cross-phase spectrum. The black curve indicates
estimated cross-phase; the grey curves delineate the 95% confi dence limits after Bendat & Piersol (1986). For cross-phase values less than 0°, Mendola leads Latemar;
for values greater than 0°, Mendola lags Latemar. Labels identify the phase relations associated with statistically signifi cant (>95%) peaks in the Magnitude-squared
coherency spectrum depicted in (c).
f
=1/36=0.028, and the 2
multitapering has the effect of averaging over
=3