Geology Reference
In-Depth Information
(a)
Mendola
4
22
27
23
21
2
26
18
19
24
25
28
3
17
20
4
5
29
2
33
34
6
8
35
36
7
9
30
1
10
32
31
11
0
12
16
15
13
14
−
2
−
4
(b)
4
Latemar
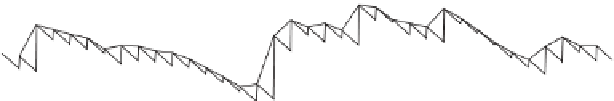
Fig. 8.
Accommodation (Fischer) plot
scripts were calculated using the
Fischer plot script (see Appendix 2
for MATLAB script). Accommodation
plots presented here are for (a) the
Mendola Pass cycle thickness series
(Cycles 1-36) and (b) the correlative
Latemar cycle thickness series (Cycles
351-386 from the Cima Forcellone sec-
tion, see Fig. 7).
2
24
28
29
23
27
22
26
25
30
18
31
19
21
20
32
33
34
35
36
0
1
2
17
3
4
5
16
6
−
2
7
8
9
15
10
14
11
12
13
−
4
0
5
10
15
20
25
30
35
Cycle number
The same technique was performed between
the Mendola and Cima Forcellone cycle thick-
ness series, shown in Fig. 7b. With the Mendola
series being only 36 points long, the running
cross-correlation values are more variable ('nois-
ier') than the comparatively highly organized
cross-correlation curve between the two Latemar
localities (compare Fig. 7a and 7b). In addition,
the Mendola Pass locality is around 30 km distant
from the Latemar Platform, and may be associ-
ated with a separate tectonic block, if not a unique
subsidence history, as several of the carbonate
platforms of the Mid-Triassic of the Dolomites
are reported to be (Doglioni, 1987, 1988; Brack &
Muttoni, 2000). This alone would be expected to
minimize the chances for a positive Mendola-
Latemar correlation at the metre-scale level of this
analysis. Nonetheless, an extremely high correla-
tion coeffi cient value of +0.6, greatly exceeding
the 95% confi dence limit of 0.375 for 36 degrees
of freedom, occurs between the Mendola and the
Cima Forcellone series from Cycles 351 to 386.
This strongly supports the idea that this is the
stratigraphic placement of the Mendola section
within the Latemar Platform.
plot of the Mendola section (Fig. 8a) shows
clear bundling of cycles into megacycles with an
average grouping of fi ve fundamental cycles into
one megacycle (5:1). The Fischer plot of the cor-
relative Latemar section (Fig. 8b) is remarkably
similar, with both bundling and overall stack-
ing trends synchronized with those at Mendola
Pass. Both Fischer plots suggest a regressive
interval over the fi rst 15 cycles (cycles thinning
upward). This trend is particularly pronounced
in the Latemar section and is followed by the
deposition of a 2.5-m-thick tepee-capped cycle
(i.e. Cycle 366; see Goldhammer, 1987), which is
the thickest cycle in the study interval. The equi-
valent cycle at Mendola Pass is also the thickest in
the study interval (3.06-m-thick), but is laminite-
capped. The remaining, upper 21 cycles are the
most strongly bundled in both sections and both
have a long-term trend suggestive of transgressive
to highstand conditions.
Harmonic analysis, coherency and
cross-phase spectra
The full suite of stratal patterns in the sections
is revealed through statistical time-series ana-
lysis. The multitaper method, in particular, is
an exceptional tool for frequency assessment of
short, highly noisy time-series (Thomson, 1982).
The multitaper method harmonic analysis pro-
cedure evaluates signal-to-noise ratios in spec-
tra, and searches for statistical outliers indicative
Fischer plots
Charts plotting the cumulative deviation from
mean cycle thickness (i.e. 'Fischer plots', after
Fischer, 1964) highlight relative accommodation
trends in platform cycle successions. The Fischer