Geology Reference
In-Depth Information
where
A
is the accretion rate (in metres per
thousand years),
0
D
is the vertical difference
between two core samples (in metres) and
G
ischle
r
t
is the
time difference (in thousands of years) between
the two samples.
5
10
15
Toscano
Choosing the right sea-level curve
Recent discussions have challenged the Lighty
et al.
(1982) curve and its subsequent iterations.
The objections generally relate to either the valid-
ity of the samples used for the curve (Blanchon,
2005) or the occurrence of numerous coral and
peat samples, largely from Belize, that sit above it
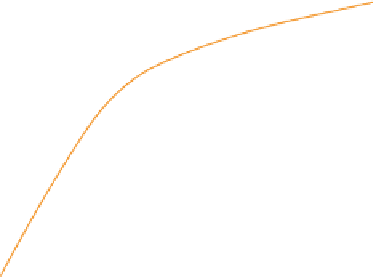
(Gischler, 2006). Figure 5 summarizes the available
A. palmata
data from the Caribbean. It includes all
the coral data from Toscano & Macintyre (2003)
plus the Belize and Campeche Bank samples of
Gischler & Hudson (2004) and Blanchon & Perry
(2004), respectively; additional, unpublished data
from the Virgin Islands and Puerto Rico are also
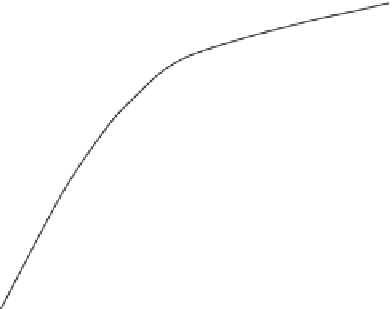
plotted. The sea-level curve that was used in this
paper (from Hubbard
et al
., 2005) is shown in black.
It is virtually identical to the curve of Toscano
& Macintyre (2003) (orange), because both are
little more than isotopically based corrections
of the Lighty
et al.
(1982) curve using either the
Beta Analytic algorithm or the similar CALIB
routine. A. Conrad Neumann's peat curve from
Bermuda (unpublished personal communication),
similarly corrected and allowing for differences
between coral and peat (
c
. 400 years) is shown in
green. Except for minor variations that are proba-
bly related to smoothing versus straight-line inter-
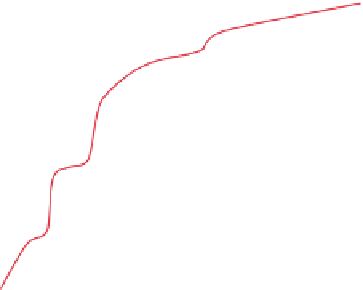
polation, the curves are again identical. The curve
proposed by Blanchon (red) displays a series of
step-like changes, reminiscent of the 'melt-water
pulses' of Fairbanks (1989). Unlike the events
proposed for Barbados, no separate isotopic
evidence for sudden melt-water releases have
been provided for any of the variations from a
smooth curve. Coral samples well above his curve
during all three proposed steps argue against their
existence. In addition, the infl ections in the curve
are in part based on an interpretation of man-
grove peat that is in fundamental confl ict with the
arguments of Gischler (2006), who argues that
the elevated
A. palmata
and peat samples from
Belize (plus Jamaica) support a fundamentally
elevated Caribbean sea-level curve (blue line).
Verifying that a particular sample is in place
has been the fundamental 'Achilles heel' of coral-
based sea-level curves. Likewise, discriminating
between reef material and allochthonous debris
20
Neumann
25
Lighty
et al
. (1981)
Toscano & Macintyre (2003)
Bl
a
nch
on
&
Pe
r
r
y
(
20
0
4)
Gischler & Hudson (2004)
B
l
a
nchon
(
200
5
)
30
Hubbard
et al.
(2005)
Eastern Caribbean (Hubbard)
35
12 000
9000
6000
3000
0
Age (Cal
14
C yr
BP
)
Fig. 5.
Variability in proposed Caribbean sea-level curves.
The data points represent the radiometric age and verti-
cal position of individual
Acropora palmata
samples
from cores throughout the region. The curve used in this
paper (black: after Hubbard
et al.,
2005) is based on both
A. palmata
and peat. This curve and the one by Toscano &
Macintyre (2003; orange) are little more than isotopically
corrected versions of the one originally proposed in Lighty
et al
. (1982; not shown). Neumann's (unpubl. pers. comm.)
curve for Bermuda (dashed green) is based on mangrove
peats, and is in general agreement. The stepped curve of
Blanchon (2006; red) was not considered because (a) it
is inconsistent with the entirety of the data, and (b) no
separate isotopic evidence has been provided to support
these drastic deviations from a smoothed trend. The curve
of Gischler (2006; blue) sits above the calibrated Lighty
curve with a maximum deviation of
c
. 3 m. The Toscano &
Macintyre curve is based on the assumption that the curve
should be placed at the bottom of what they interpreted
as intertidal to slightly supratidal peats. Gischler's curve
(Gischler & Hudson, 2004) straddles the top of the same
peat-coral package.
thrown up onto supratidal storm ridges further
complicates the matter. A detailed discussion of
these problems and a solid defence of one par-
ticular curve over another is beyond the scope
of this paper. However, it is worth noting that all
the curves follow the same general pattern, and
an approximate average of all the curves falls
somewhere close to the black line in Fig. 5. The
maximum difference between the three more
central curves and either of the other two amounts
to 3 m. The absolute depth of one particular
sample might vary by up to that much, but it
seems unlikely that the overwhelming patterns
described below could be fundamentally changed.
Nevertheless, the general impacts of choosing one
curve over another will be discussed later.