Geology Reference
In-Depth Information
0
(
d
< 5 m)
Coral growth
(
d
= 10-20 m)
5
10
Reef accretion
Palaeodepth
15
0
50 100
Rate (m kyr
−
1
or mm yr
−
1
)
150
S2
20
Δ
D
Fig. 2.
Reef accretion versus sea-level rise and coral growth
(
d
25
water depth). In this scenario by Schlager (1981),
shallow reefs (depth less than 5 m) are expected to build
an order of magnitude faster than their deeper-water
counterparts. This is explained largely by the dominance
of faster-growing branching corals in shallow water.
=
S1
Δ
t
30
12 000
9000
6000
3000
0
Age (Cal
14
C yr
BP
)
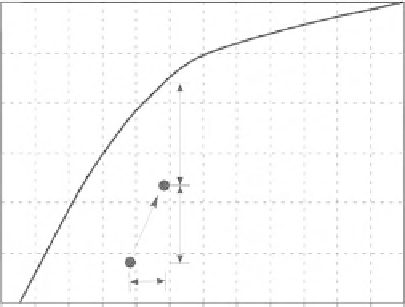
Fig. 4.
Illustration of measurements used in this paper.
Palaeodepth (
D
p
) is computed as the difference between
the position of a recovered sample and sea level at the
time it was deposited. Time of deposition is based mostly
on calibrated radiocarbon measurements. Accretion was
calculated as
0
10
D
/
t
.
20
reservoir effects, and biological fractionation
for marine carbonates using a presumed iso-
topic value of
Drown
Keep up
30
13
C ~ 0, unless otherwise speci-
fi ed. The procedure is similar to that used by the
freeware program CALIB, except that it oper-
ates on smoothed data by visually scanning for
short-term perturbations in the calibration curve
(D. Hood, personal communication). U/Th ages
were used as reported. Errors in age were typically
100 years or less, and are assumed to be randomly
distributed about the reported dates.
40
50
0
5
10
15
Rate (mm yr
−
1
or m kyr
−
1
)
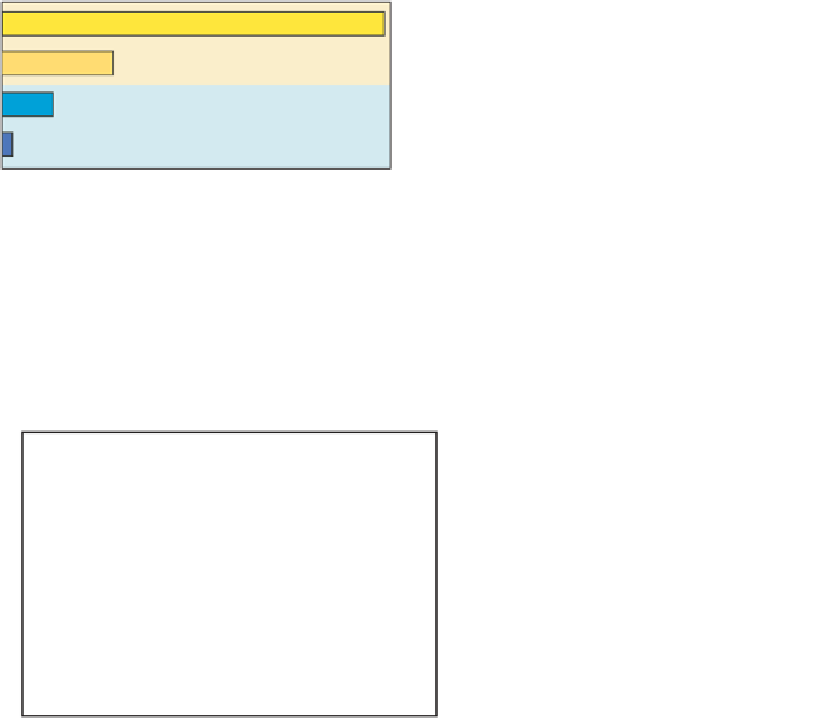
Fig. 3.
Summary of presumed depth-related patterns of reef
accretion and coral growth. While coral growth (yellow)
can exceed 10 cm yr
1
in some shallow-water species, it
generally drops from a maximum of
c
. 10-20 mm yr
1
in
shallow water to less than 1 mm yr
1
at depth. Based on
rates quoted in the previous literature, reef accretion (red)
should decrease following a similar pattern, but at rates
an order of magnitude slower. According to Schlager's
(1981) 'Drowning Paradox', many shallow-water reefs in
the past have built up faster than the highest rates of glacio-
eustatic sea-level rise (~ 7 m kyr
1
: light blue bar). Those
reefs should have been able to keep up with rising sea
level, while their slower-building cohorts drowned.
Palaeowater depth
Water depth at the time of deposition was
calculated as the vertical difference between the
present depth of a coral sample and the height
of sea level at the time corresponding to its
radiometric age (Fig. 4). It is assumed that the
recovered coral was either in place or was alive
close to the time when it was deposited. Hindcast
sea level is based on the corrected Lighty
et al
.
(1982) sea-level curve as presented in Hubbard
et al
. (2005). This curve is virtually identical to
the curve of Toscano & Macintyre (2003), which
used many of the same samples and a nearly
identical correction algorithm (i.e. CALIB
vs. the
proprietary Beta calibration). The rate of accretion
was calculated using the formula:
literature. The precision of the depth information
varied among studies, but errors are most likely
random and are not thought to impact the gen-
eral patterns shown below. Reported radiocarbon
ages were calibrated by Beta Analytic, Inc. using
the INTCAL-98 data set (Stuiver
et al
., 1998)
and methods similar to those of Talma & Vogel
(1993). This transformation takes into account
metabolic variations between sample types
(i.e. coral vs. shell, wood, etc.), global/local
A
= (
D
/
t
)