Geology Reference
In-Depth Information
1953
(a)
(a-2)
1953
Homestead Canal West
1999
(b-2)
1999
(b)
(c)
2005
(c-2)
2005
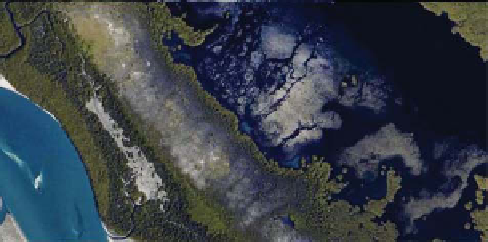
Fig. 6.
Aerial photographs (1953,
1999) and satellite image (2005-Ikonos
© GeoEye) with interpretative maps
of southern Lake Ingraham showing
infi lling history. Yellow areas are out
of water at most low tides; green is
wetland and non-shaded is subtidal.
The darker shade along the main chan-
nel in (c) is much higher and thus drier
than the surrounding white colour. The
elongate form and single axial channel
is the result of motorboat traffi c.
500 m
rates, measured with sediment reference
markers along ECC, in Lake Ingraham and the
Southern Lakes, range from 3 to 14 cm yr
−1
(Table 1;
Fig. 8a). The highest sedimentation rates
(11-14 cm yr
−1
) are measured along the banks of
tidal creeks that connect ECC to the Southern
Lakes (Fig. 3b). These observations suggest that
large amounts of sediment are still being fed into
the Southern Lakes. Within Lake Ingraham, the
lower parts of the delta are accumulating rap-
idly at 5-7 cm yr
−1
, whereas the oldest (and pres-
ently highest) parts of the delta are accreting at
3-4 cm yr
−1
. The lower sedimentation rates and
Overwash
sediment
Marl Ridge
100 m
Fig. 7.
Aerial photograph (2002) displaying overwash
sediments into interior collapsed marsh. Water to the left is
the northern extent of Lake Ingraham.