Geology Reference
In-Depth Information
(a)
(b)
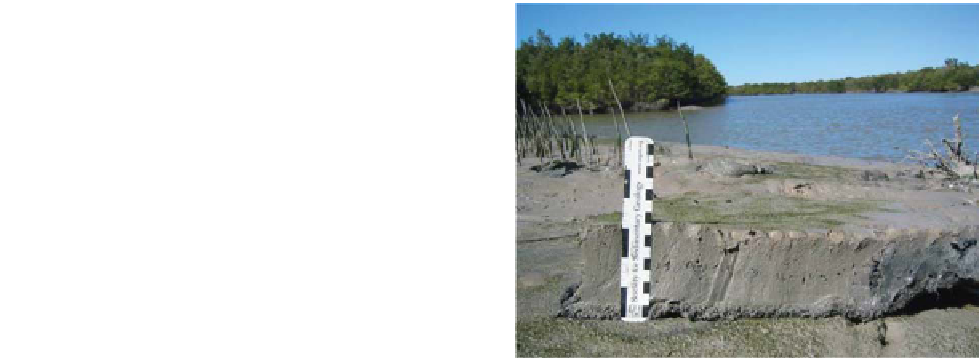
8.5 cm/6 months
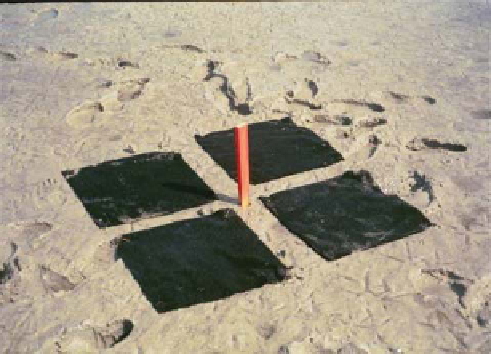
Fig. 3.
(a) 40
40 cm carpet tiles as artifi cial marker horizons. Thirty-fi ve sediment reference markers have been deployed
on the intertidal mudfl ats along East Cape Canal, in Lake Ingraham and the Southern Lakes (for location see Fig. 8);
(b) Example of rapid sedimentation along the levees of East Cape Canal: 8.5 cm sedimentation from 4 July to 5 January
(6 months) at sediment marker 107.
×
13
C
POC)
and the organic carbon in the sediment. All data
are reported relative to Vienna-Peedee Belemnite
(V-PDB) standard.
particulate organic carbon fraction (
δ
Sediment characteristics
Grain size was determined with an electro-resist-
ance particle size analyser. Sediment samples
were wetted to disaggregate grains and then
added to the fl uid module on a Coulter Counter
analyser, which measures particles from 0.04 μm
to 2 mm.
Percentages of total organic matter (TOM), cal-
cium carbonate and insoluble residue were mea-
sured on core, sediment reference marker and
suspended sediment samples. Sediments were
dried and ground with a mortar and pestel, and
approximately 5 g of sediment was combusted at
550°C for 4 hours to determine the organic matter
fraction. Results were accurate to 1-2% for organic
matter. Subsequently 50 mg of the combusted
sample was leached with 10% HCl to determine
an estimate of percentage carbonate loss (Van
Iperen & Helder, 1985). The residue after com-
bustion and dissolution contained mainly quartz,
opaline silica and clay minerals.
SOUTHERN LAKES
Station 1: turbidity - current velocity (only 3 days)*
Station 2: water depth - turbidity - salinity
Station 3: turbidity (discontinuous)
Station 4: water depth - current velocity - turbidity
Station 5: water depth - turbidity - salinity
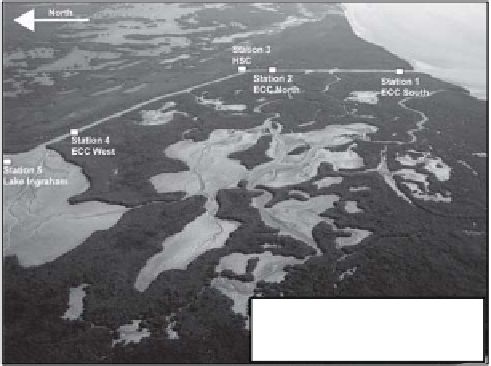
Fig. 4.
Oblique aerial photograph during low tide of
East Cape Canal (ECC), Homestead Canal South (HSC),
East Side Creek (ESC), the Southern Lakes and part of
the southeastern delta in Lake Ingraham with the positions
of the measurement stations and parameters measured
at each station. Width of photograph is 2 km. *Turbidity
and current velocity are not measured simultaneously
(Station 1).
2005 (Fig. 4). All instruments were mounted on
weighted frames placed on the channel bottoms.
Data were collected at 1 m above the bottom every
10 minutes, and over time periods ranging from
days to 4 weeks. Current velocity and direction
were measured with a Sontek Acoustic Doppler
Current Profi ler (ADCP), which generates a ver-
tical velocity profi le with depth cell intervals of
0.25 m (accuracy is 0.5 cm s
−1
). Water-level fl uctu-
ations were indirectly determined from the ADCP,
Hydrodynamic data acquisition
Continuous measurements of current velocity,
water level, suspended sediment concentration
and salinity were taken during several measure-
ment campaigns between July 2003 and March