Environmental Engineering Reference
In-Depth Information
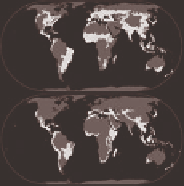
Crisis ecoregions
(Hoekstra et al., 2005)
305 ecoregions with ≥20% habitat conversion and within
which the percentage conversion is ≥2 times the percentage
protected area coverage
Biodiversity hotspots
(Myers et al., 2000)
34 biogeographically similar aggregations of ecoregions
holding ≥0.5% of the world's plants as endemics, and with
≥70% of primary habitat already lost [Myers 1990, 1991;
Mittermeier et al., 1998, 1999, 2004]
Endemic bird areas
(Stattersield et al., 1998)
218 regions holding ≥2 bird species with global ranges of
<50 000 km
2
, and with more of these endemic than are
shared with adjacent regions [ICBP 1992; Crosby 1994;
Long et al., 1996]
Centres of plant diversity
(WWF and IUCN 1994-97)
234 mainland sites holding >1000 plant species, of which
≥10% are endemic either to the site or the region; or islands
containing ≥50 endemic species or ≥10% of lora endemic
EBA
CPD
Megadiversity countries
(Mittermeier et al., 1997)
Countries holding ≥1% of the world's plants as endemics
[Mittermeier, 1988]
MC
Global 200 ecoregions
(Olson and Dinerstein, 1998)
142 terrestrial ecoregions within biomes characterized
by high species richness, endemism, taxonomic uniqueness,
unusual phenomena, or global rarity of major habitat
type [Olson and Dinerstein, 2002]
G200
High-biodiversity wilderness areas
(Mittermeier et al., 2003b)
Five biogeographically similar aggregations of
ecoregions with ≥0.5% of the world's plants as endemics,
and with ≥70% of primary habitat remaining and
≥5 people per km
2
[Mittermeier et al., 1998, 2002]
Frontier forests
(Bryant et al., 1997)
Forested regions large enough to support viable
populations of all native species, dominated by native
tree species, and with structure and composition driven
by natural events
HBWA
FF
Last of the wild
(Sanderson et al., 2002)
10% wildest 1-km
2
grid cells in each biome, with wildness
measured with an aggregate index of human density, land
transformation, access and infrastructure
LW
Note:
For each proposal, we note primary references, dei nitions paraphrased from the
primary references, maps from the primary references except for Global 200 ecoregions
(Olson and Dinerstein, 2002) and biodiversity hotspots (Mittermeier et al., 2004) for which
more recent maps are available, and secondary references in square brackets. The Global
200 ecoregions also include 53 freshwater and 43 marine ecoregions, not mapped.
Figure 2.1
Global biodiversity conservation prioritizations