Image Processing Reference
In-Depth Information
(3.40) increase with the increase in proximity of the graylevel bin corresponding to g
a
from
the corresponding regions. Thus the expressions in (3.39) and (3.40) give measures of farness
of the graylevel bin corresponding to g
a
from the regions and hence we refer the measures
as the proximity errors. The symbol C is a constant such that the values of e
p
and e
p
when
g
a
equals g
b
−1 and g
d
+ 1, respectively, are same and hence the proximity error values are
not biased towards any region. As can be deduced from (3.39) and (3.40), the proximity
errors would take values in the range [0, 1]. The various arrays defined in this section are
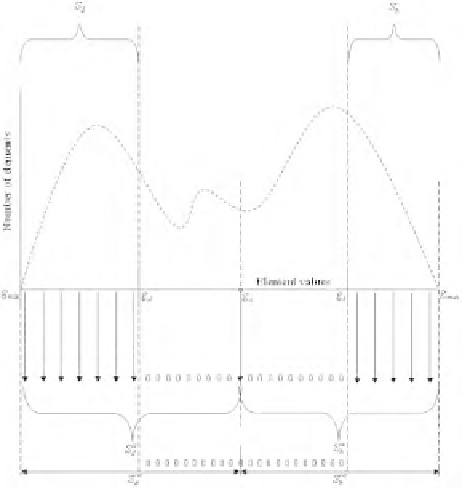
graphically shown in Figure 3.5.
FIGURE 3.5: The various defined arrays shown for a multimodal histogram
From Section 3.3, we find that we need to define the crossover point T , the bandwidth ∆
of the Z-function and the granule size ω in order to measure grayness ambiguity. For the
calculation of the association errors corresponding to the bright and dark regions, we define
the respective crossover points as
g
a
+ g
b
2
T
b
=
(3.41)
g
d
+ g
a
2
and
T
d
=
(3.42)
Considering the above expressions for the crossover points and the explanation in Sec-
tion 3.3, it can be easily deduced that the grayness ambiguity measures in (3.39) and (3.40)
increase with the increase in proximity of the graylevel bin corresponding to g
a
from the
defined regions.
While calculating the association errors corresponding to both the bright and dark re-
gions, it is important that same bandwidth (∆) and same granule size (ω) be considered.
As presented earlier in (3.36), the errors due to the association of a gray value from the


Search WWH ::

Custom Search