Image Processing Reference
In-Depth Information
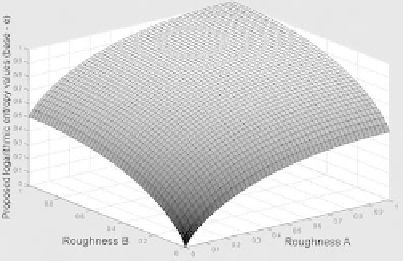
(a) Plot of the proposed logarithmic class of
entropies for various roughness values
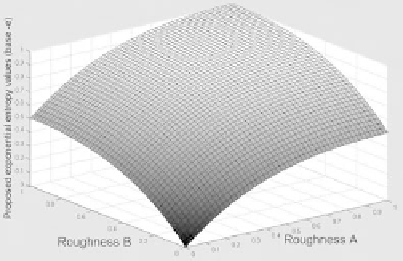
(b) Plot of the proposed exponential class of
entropies for various roughness values
A
and
B
A
and
B
FIGURE 3.2: Plots of the proposed classes of entropy measures
FIGURE 3.3: Plots of the proposed entropy measures for a few values of the base β, when A = B
Both H
R
(A, B) and H
R
(A, B) are concave functions of A and B, where A, B∈
[0, 1], as they satisfy the inequality given in (3.23) when appropriate values of β
and the convention 0 log
β
0 = 0 are considered.
The plots of the proposed classes of entropies H
R
and H
R
as functions of A and B are
given in Figures 3.2 and 3.3, respectively. In Figure 3.2, the values of H
R
and H
R
are shown
for all possible values of the roughness measures A and B considering β = e. Figure 3.3
shows the plots of the proposed entropies for different values of the base β, when A = B.
3.3
Measuring Grayness Ambiguity in Images
In this Section, we shall use the entropy measures proposed in the previous section in order
to quantify the grayness ambiguity (See Section 3.1) in a grayscale image. As we shall see
later, the entropy measures based on the generalization of rough set theory regarding the


Search WWH ::

Custom Search