Image Processing Reference
In-Depth Information
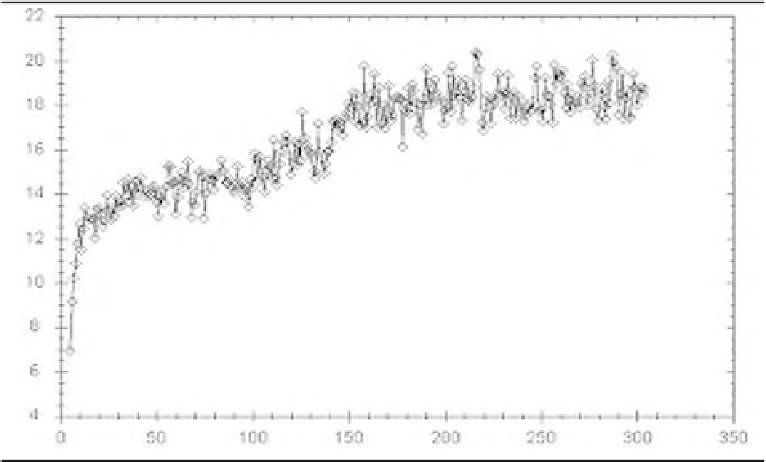
diagrammatically presented. In the diagram average β-index measure as described in Sub-
section 11.3.2 in each of the 300 population has been given. From the graph shape general
increasing tendency has been depicted.
Satellite build-up area image - RGB - average
β
-index measure during all iterated pop-
FIGURE 11.4
ulations
In Figure 11.5 the values of correlation between Dunn index and R4 measure in all 300
populations have been diagrammatically presented. From the graph shape general positive
correlation tendency has been depicted.
In Figure 11.6 the values of correlation between DB index and R4 measure in all 300
populations have been diagrammatically presented. From the graph shape general negative
correlation tendency has been depicted.
In Figure 11.7 the values of correlation between β-index index and R4 measure in all 300
populations have been diagrammatically presented. From the graph shape general positive
correlation tendency has been depicted.
In Figure 11.8 the values of correlation between R1 and R4 measures in all 300 populations
have been diagrammatically presented. From the graph shape general positive correlation
tendency has been depicted.
There is a growing need for effective segmentation routines capable of handling different
types of imagery suitable for their characteristics and area of application. High quality of
image segmentation requires incorporating reasonably as much information of an image as
possible. This kind of combining diverse information in a segmentation understood as a
means of improving algorithm performance has been widely recognized and acknowledged,
see for example (Gonzales and Woods, 2002) for details.


Search WWH ::

Custom Search