Image Processing Reference
In-Depth Information
(10.8a)
(10.8b)
(10.8c)
(10.8d)
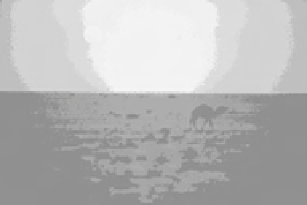
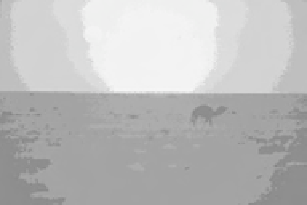
FIGURE 10.8:
(Please see color insert for Figures 10.8a and 10.8d)
Segmentation compari-
son. (a)Test image271031(b)Histogram based segmentation (c)Histon based segmentation
(d)Roughness index based segmentation
TABLE10.1 Comparison of the results of the proposed approach with
the results of the histogram-based thresholding method
Image Thresholding
Numberofclusters
CPUtimePSNR PRI
method
(sec) (dB)
Before After
mergingmerging
22013 Histogram 101 15 2.60 21.600.7327
Histon 152 13 3.95 22.070.7449
Roughnessmeasure 153 14 5.60 24.710.7550
92059 Histogram 75 5 2.23 20.340.6677
Histon 79 6 2.31 20.750.6652
Roughnessmeasure 57 6 3.70 23.860.6717
97017 Histogram 84 10 2.29 22.840.7251
Histon 85 9 2.50 23.190.7325
Roughnessmeasure 87 10 3.38 23.300.7910
140055 Histogram 189 14 4.88 22.570.7500
Histon 201 11 5.14 23.650.7436
Roughnessmeasure 92 13 2.51 24.220.7779
172032 Histogram 112 12 2.56 25.350.8502
Histon 116 11 2.61 25.400.8502
Roughnessmeasure 116 12 3.01 25.730.8718
271031 Histogram 22 8 0.936 22.170.7008
Histon 22 8 0.936 22.870.7107
Roughnessmeasure 22 4 1.809 25.900.7300


Search WWH ::

Custom Search