Image Processing Reference
In-Depth Information
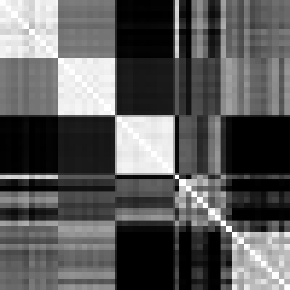
Similarity Matrix − Sim2 − tNM
Similarity Matrix − Sim1 − TOD
1
Aerial (1).tiff−[1]
Aerial (10).tiff−[2]
Aerial (2).tiff−[3]
Aerial (3).tiff−[4]
Aerial (4).tiff−[5]
Aerial (5).tiff−[6]
Aerial (6).tiff−[7]
Aerial (7).tiff−[8]
Aerial (8).tiff−[9]
Aerial (9).tiff−[10]
Man (1).tiff−[11]
Man (10).tiff−[12]
Man (2).tiff−[13]
Man (3).tiff−[14]
Man (4).tiff−[15]
Man (5).tiff−[16]
Man (6).tiff−[17]
Man (7).tiff−[18]
Man (8).tiff−[19]
Man (9).tiff−[20]
Motion (1).jpg−[21]
Motion (10).jpg−[22]
Motion (2).jpg−[23]
Motion (3).jpg−[24]
Motion (4).jpg−[25]
Motion (5).jpg−[26]
Motion (6).jpg−[27]
Motion (7).jpg−[28]
Motion (8).jpg−[29]
Motion (9).jpg−[30]
Satellite (1).jpg−[31]
Satellite (10).jpg−[32]
Satellite (2).jpg−[33]
Satellite (3).jpg−[34]
Satellite (4).jpg−[35]
Satellite (5).jpg−[36]
Satellite (6).jpg−[37]
Satellite (7).jpg−[38]
Satellite (8).jpg−[39]
Satellite (9).jpg−[40]
brain (1).jpg−[41]
brain (10).jpg−[42]
brain (2).jpg−[43]
brain (3).jpg−[44]
brain (4).jpg−[45]
brain (5).jpg−[46]
brain (6).jpg−[47]
brain (7).jpg−[48]
brain (8).jpg−[49]
brain (9).jpg−[50]
0.9
0.9
0.8
0.8
0.7
0.7
0.6
0.6
0.5
0.5
0.4
0.4
0.3
0.3
0.2
0.2
0.1
0.1
0
0
1 2 3 4 5 6 7 8 91011121314151617181920212223242526272829303132333435363738394041424344454647484950
1 2 3 4 5 6 7 8 9 1011121314151617181920212223242526272829303132333435363738394041424344454647484950
FIGURE 8.17: Matrix of TOD and tNM similarity measures between pairs of images
=0
.
1, p=10
calculated for each possible pair of images where
B
=
{φ
,φ
}
consists of normalized
1
2
gray level and entropy probe functions and
1. Images are 256 by 256 pixels
in size and the subimage size is 10 by 10 pixels. Figure 8.17 displays TOD and
tNM similarity matrices where the similarity between images of the same group is
generally higher.
=
.
8.4
Summary and Conclusions
In a perceptual system approach to discovering image similarities, images are consid-
ered as sets of points (pixels) with measurable features such as colour,
i.e.
,points
with feature values that we can perceive. Inspired by rough set theory, near set
theory provides a framework for describing anities between sets of perceptual ob-
jects and thus can be used to define description-based similarity measures between
images. In this framework, tolerance spaces can be used to establish a realistic con-
cept of nearness between sets of objects where equalities hold only approximately
within a tolerance level of permissible deviation. This tolerance space form of near
sets provides a foundation for modeling human perception in a physical continuum.
Therefore, a perceptual image processing approach is rapidly growing out of the
near set theory in recent years. See (Peters, 2009, 2010; Henry and Peters, 2009b;
Peters and Wasilewski, 2009) and (Henry and Peters, 2009a), for example.
In this chapter, two novel measures of image similarity based on tolerance spaces
have been introduced and studied. The first nearness measure (tNM) was previously
published in (Henry and Peters, 2008) and the second measure (TOD) was first pro-
posed by the authors in (Meghdadi et al., 2009) and further elaborated and tested
here. Both measures were tested on sample pairs of images and their dependence
on the method parameters such as tolerance level (
) and perceptual subimage size
was studied. In order to evaluate the measures, nearness within and between groups
ε


Search WWH ::

Custom Search