Image Processing Reference
In-Depth Information
For a single image, tolerance classes can be calculated as shown in section 8.2.2
and displayed in a tolerance matrix or ordered tolerance matrix as shown in the
simple example of Figures 8.5 and 8.6. The main approach in this chapter for
comparing pairs of images is to compare the corresponding tolerance classes. Size
of the tolerance classes, the overlap between tolerance classes and their distributions,
for example can be used to quantitatively compare the image tolerance classes.
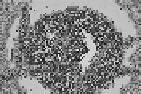
Lattice Valued Tolerance Matrix
FIGURE 8.8: An image covering and the ordered tolerance matrix (30
×
30 subim-
ages)
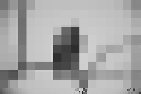
Lattice Valued Tolerance Matrix
FIGURE 8.9: An image covering and the ordered tolerance matrix (30
×
30 subim-
ages)
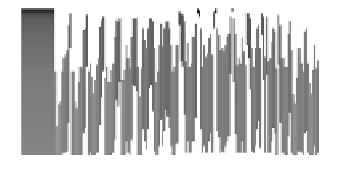
Lattice Valued Tolerance Matrix
FIGURE 8.10: An image covering and the ordered tolerance matrix (30
×
30 subim-
ages)


Search WWH ::

Custom Search