Image Processing Reference
In-Depth Information
NSI is also displayed on the left hand side.
7.8
Near image frame
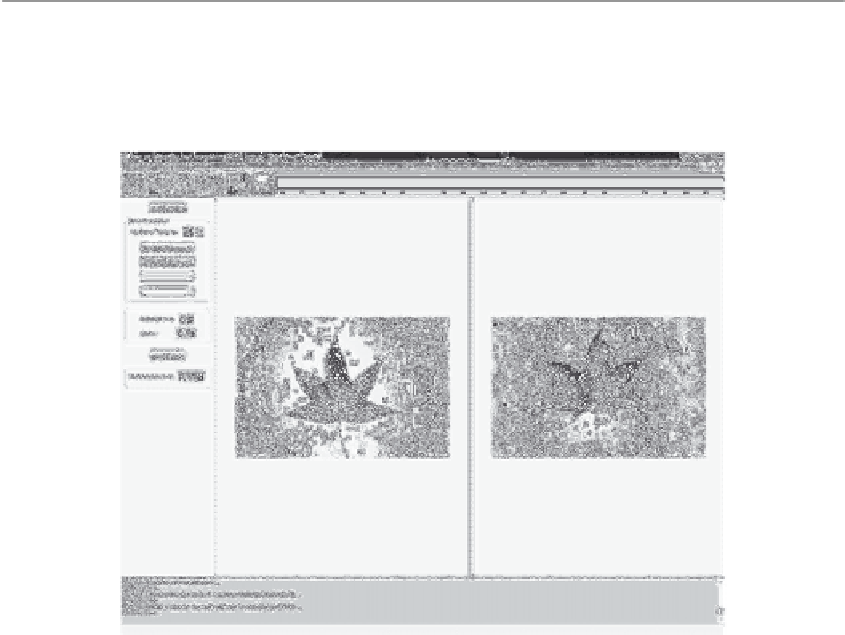
This frame is used to calculate the nearness of two images using the nearness measure from
Eq. 7.3 defined in Section 7.2. A sample calculation using this frame is given in Fig. 7.16
and was obtained by the following steps:
FIGURE 7.16: Sample run of the near image frame using a window size of 10×10,B=
{φ
,φ
H
Shannon
}, and ε = 0.05.
NormG
1. Click Load Images button and select two images.
2. Select number of features (maximum allowed is four).
3. Select features (see Section 7.4 for a list of probe functions).
4. Select window size. The value is taken as the square root of the area for a square
subimage, e.g., a value of 5 creates a subimage of 25 pixels.
5. Select ε, a value in the interval [0, 1].
6. Click Run.
The result is given in Fig. 7.16 where the left side contains the first image, and the right
side contains the second image. Clicking in any of the two images will display the tolerance
classes from both images near to the subimage selected by the mouse click. The subimage
matching the coordinates of the mouse click is coloured black and all subimages that are
near to the black subimage are displayed using a different colour for each class. The NM is
also displayed on the left hand side.


Search WWH ::

Custom Search