Database Reference
In-Depth Information
# substitute YOUR_EMAIL_ADDRESS with your email id.
/usr/bin/printf "%b" "Hi Nishant, \nthis is Nagios." | /bin/
mail -s "Nagios test mail" YOUR_EMAIL_ADDRESS
If this does not reach your mail box or the spam folder, you should check your configura-
tion. If you do not have the mail utility installed already, execute the following command:
# mail utility on RHEL like OS
$ sudo yum install mailx
# On Ubuntu or Debian derivatives
$ sudo apt-get install mailutils
If you are not happy with the mailing option or want to change the mailer to send mail via
a specific mail provider such as Gmail, you should dig into the plugins directory or
GitHub to find appropriate alternatives.
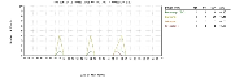
Nagios provides a pretty intuitive GUI—a web-based console that immediately highlights
anything that is wrong with any service or host. Apart from displaying the immediate
state, Nagios also stores the history of monitored events. There are many reporting capab-
ilities that provide a complete infrastructure status overview. One can easily generate a
histogram that states the performance of a service, as shown in the following screenshot:
An auto-generated histogram report from Nagios
There are many reporting options, including options to disable alerts during a scheduled
infrastructure downtime. It may be worth playing around the Nagios GUI to learn about
the various options.