Database Reference
In-Depth Information
command[check_hda1]=/usr/local/nagios/libexec/
check_disk -w 20% -c 10% -p /dev/hda1
[-- snip --]
#custom commands *add your commands here*
# EC2 ephemeral storage root disk
command[check_sda1]=/usr/local/nagios/libexec/
check_disk -w 20% -c 10% -p /dev/sda1
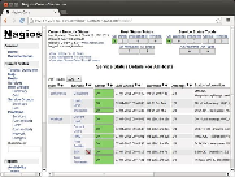
The following screenshot shows the Nagios interface monitoring local and remote
resources:
As you can see, we have a CPU check (
check_load
) and a disk check already
provided by the default configuration. However, if I wanted to monitor the
/dev/sda1
device for space availability, I would add a new check
check_sda1
for this.
•
Setting up a JMX monitor
: For Cassandra, we want to check the JVM heap us-
age via JMX. Since this executes on the local machine (Nagios) to connect to the
JMX service on the remote machine, we do not need to use NRPE for this. Thus,
we have nothing to do here.
•
Updating configuration
: The best part of Nagios is its configuration. With a
little ingenuity and grouping, you can make a fine configuration that can scale to
hundreds of machines. All configurations in Nagios are text-based with a JSON-
ish syntax. You can have files organized in whichever way you want and let Na-
gios know where the files are. For this particular case, the
/usr/local/
nagios/etc/objects/cassandrahosts.cfg
file is created. This file
houses all the information related to monitoring. The following code snippet is
what it looks like (see the comments in bold):