Database Reference
In-Depth Information
Monitoring and administrating with OpsCenter
OpsCenter exposes all the functionality of JMX via a web console. This means everything
that we were able to do using
nodetool
we can now do with OpsCenter. Most of the
node-level administrative options are available by clicking on the node (under the
Cluster
View
menu) and then clicking on the
Action
button.
For cluster-wide operations, there are menus under the cluster view page. You can add a
node, change the configuration file cluster-wide, and perform a rolling restart of the cluster.
In the paid version, you can create a cluster, add more than one cluster to OpsCenter, down-
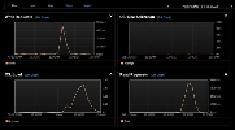
load information to diagnose a problem, and generate reports. The following screenshot
shows a subset of monitoring options by OpsCenter:
OpsCenter provides a plethora of attributes to keep a tab on. It covers Cassandra-specific
attributes such as read/write requests; pending tasks in different stages; the row and key
cache hit rate; table-specific statistics such as pending read and writes and SSTables size
and count; and operating system resource-specific statistics such as CPU, memory, disk us-
age, and network. Basically, a superset of monitoring options is provided by
nodetool
.
To add more plots to the
Performance
screen, you need to click on the
Add Graph
button
and select the appropriate graph. To make this setting permanent, save this plot setting by
choosing
Save as...
from the drop-down menu next to the
Performance Metrics
heading.