Environmental Engineering Reference
In-Depth Information
distributed random variables, under some very general
conditions, it can be shown that if
X
1
,
X
2
, . . . ,
X
n
are
n
random variables with means
μ
1
,
μ
2
, . . . ,
μ
n
and standard
deviations
σ σ
0.6
y
= ln
x
0.5
2
,
2
,
,
σ
n
, respectively, then the sum,
S
n
,
2
…
m
y
= 0.5,
s
y
= 0.5
1
2
0.4
defined by
0.3
S
=
X X
+
2
+
+
X
(10.24)
n
1
n
0.2
is a random variable whose probability distribution
approaches a normal distribution with mean,
μ
, and
variance,
σ
2
given by
m
y
= 1.0,
s
y
= 1.0
0.1
0.0
0
1
2
3
4
5
6
7
8
9
10
n
∑
i
i
µ
=
µ
(10.25)
x
=
1
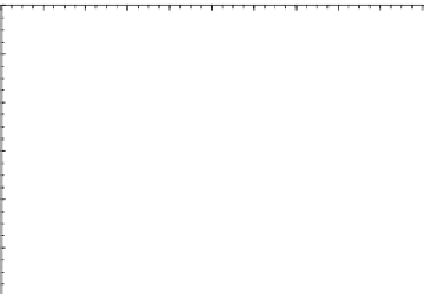
Figure 10.2.
log-normal probability distribution.
n
∑
i
i
σ
2
=
σ
2
(10.26)
=
1
trated in Figure 10.2 for various values of
μ
y
and
σ
y
. The
mean, variance, and skewness of a log-normally distrib-
uted variable,
X
, in terms of the parameters of the log-
transformed variable,
μ
y
and
σ
y
, are given by
The application of this result generally requires a
large number of independent variables to be included
in the sum
S
n
, and the probability distribution of each
X
i
has negligible influence on the distribution of
S
n
.
2
σ
y
µ
=
exp
µ
+
(10.31)
x
y
2
10.3.2 Log-Normal Distribution
In cases where the random variable,
X
, is equal to the
product of
n
random variables
X
1
,
X
2
, . . . ,
X
n
, such that
σ
2
=
µ
2
[exp(
σ
2
)
−
1
]
(10.32)
x
x
y
g
x
=
3
C C
+
3
(10.33)
v
v
X X X
=
2
X
n
(10.27)
1
where C
v
is the coefficient of variation defined as
then logarithm of
X
is equal to the sum of
n
random
variables, where
v
=
σ
x
C
µ
(10.34)
x
ln
X
=
ln
X
+
ln
X
2
+
+
ln
X
n
(10.28)
1
If
Y
is defined by the relation
Therefore, according to the central limit theorem,
ln
X
will be asymptotically normally distributed, and
X
is said to have a
log-normal distribution
. Defining the
random variable,
Y
, by the relation
Y
= log
10
X
(10.35)
then Equation (10.30) still describes the probability
density of
X
, with ln
x
replaced by log
x
, and the moments
of
X
are related to the moments of
Y
by
(10.29)
Y
= ln
X
then if
Y
is normally distributed, the theory of random
functions can be used to show that the probability
density function of
X
, the log-normal distribution, is
given by
2
2
(
µ σ
+
/ )
(10.36)
µ
=
10
y
y
x
2
(
σ
)
σ
2
=
µ
2
10
−
1
(10.37)
y
x
x
3
(10.38)
g
x
=
3
C C
+
v
v
2
ln
x
−
µ
1
1
2
y
(10.30)
f x
( )
=
exp
−
,
x
>
0
EXAMPLE 10.2
σ
x
σ
2
π
y
y
The natural logarithms of concentration data collected
in a coastal water follow a normal distribution with a
mean of 2.97 and a standard deviation of 0.301, where
where
μ
y
and
σ
2
are the mean and variance of
Y
, respec-
tively. The shape of the log-normal distribution is illus-


Search WWH ::

Custom Search