Environmental Engineering Reference
In-Depth Information
10
7
10
6
10
5
10
4
10
3
K
a
= 0.0103
L
1.15
Figure 9.12.
Transition from near- to far-field mixing.
Source
:
Wood (2005).
10
2
10
1
10
3
10
4
10
5
10
6
10
7
10
8
the variance,
σ
r
2
(l
2
), of the entire tracer cloud was
calculated using the relation
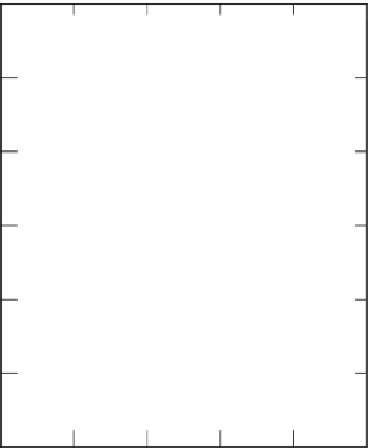
Length scale,
L
(cm)
Figure 9.13.
Apparent diffusion coefficient versus length scale
in coastal waters.
∞
∫
∫
r c
2
2
π
r dr
e
e
e
σ
2
=
0
(9.54)
rc
∞
c
2
π
r dr
e
e
=
σ
2
4
0
rc
(9.57)
K
a
t
where
c
(
r
e
,
t
) (Ml
−3
) is the concentration with an
equivalent circular contour of radius
r
e
(l) at time
t
.
The characterization of the variance of a tracer distribu-
tion by
σ
r
2
can be compared with the variance charac-
terization of bivariate gaussian distributions, which
requires specification of the variances along both the
major and minor principal axes. If the tracer distribution
is gaussian and the variances along the major
and minor axes are
σ
2
and
σ
2
, respectively, it can be
shown that
Defining the length scale,
L
, of the tracer cloud by
L
= 3
r
σ
(9.58)
the results of field-scale dye studies were used to plot
the apparent diffusion coefficient,
K
a
, versus the length
scale,
L
, of the cloud, and these results are shown in
Figure 9.13. These data show a good match to the empir-
ical relation
r
2
σ
=
2
σσ
y
(9.55)
K
= 0 0 0
.
1 3
L
1 15
.
(9.59)
x
a
Plotting
σ
r
2
versus time for several instantaneous dye
releases in the surface layers of coastal waters showed
that the following empirical relationship provided a rea-
sonably good fit to observations:
where
K
a
is in cm
2
/s and
L
is in centimeters. Equation
(9.59) is widely used in practice to estimate the apparent
diffusion coefficient as a function of length scale for
contaminants released into the ocean. Studies reported
by Zimmerman (1986) and Roberts (1999) have shown
that for travel times of a few hours, typical apparent
diffusion coefficients are on the order of 0.1-1 m
2
/s
(0.3-3 ft
2
/s); for time scales up to a day or so, vertical
velocity shear is usually most important, resulting in
apparent diffusion coefficients on the order of 10 m
2
/s
(30 ft
2
/s); and for longer times, horizontal shear domi-
nates and the apparent diffusion coefficient may be in
the range of 100-1000 m
2
/s (300-3000 m
2
/s).
σ
r
2
2.34
(9.56)
=
0.0108
t
where
σ
r
2
is measured in cm
2
,
t
is the time since
release, measured in seconds, and values of
t
ranged
from 2 hours to nearly 1 month. The variance of a
tracer cloud as a function of time can be used to calcu-
late an apparent diffusion coefficient,
K
a
, using the
relation


Search WWH ::

Custom Search